. 2018 Apr 20;48(3):133–142. doi: 10.4041/kjod.2018.48.3.133

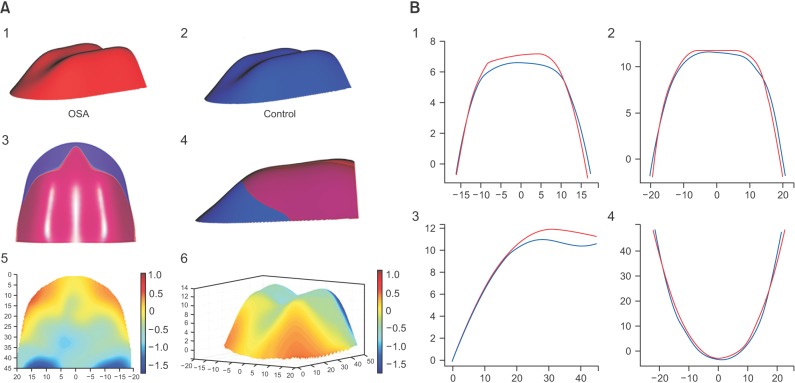
Figure 3. A, Comparison of the three-dimensional (3D) palate of the obstructive sleep apnea (OSA) and control groups. 1, The 3D palate of the OSA group; 2, the 3D palate of the control group; 3 and 4, superimposition of the OSA and control groups; 5 and 6, the color map of the difference between the OSA and control groups. The blue color means that the hard palate of the OSA group is higher than that of control group, and the red color means the opposite. B, The twodimensional comparison of the palates of the OSA and control groups in the first premolar (1), first molar (2), palatal suture (3), and palatal undersurface section (4). Red, OSA group; blue, control group.

Figure 3