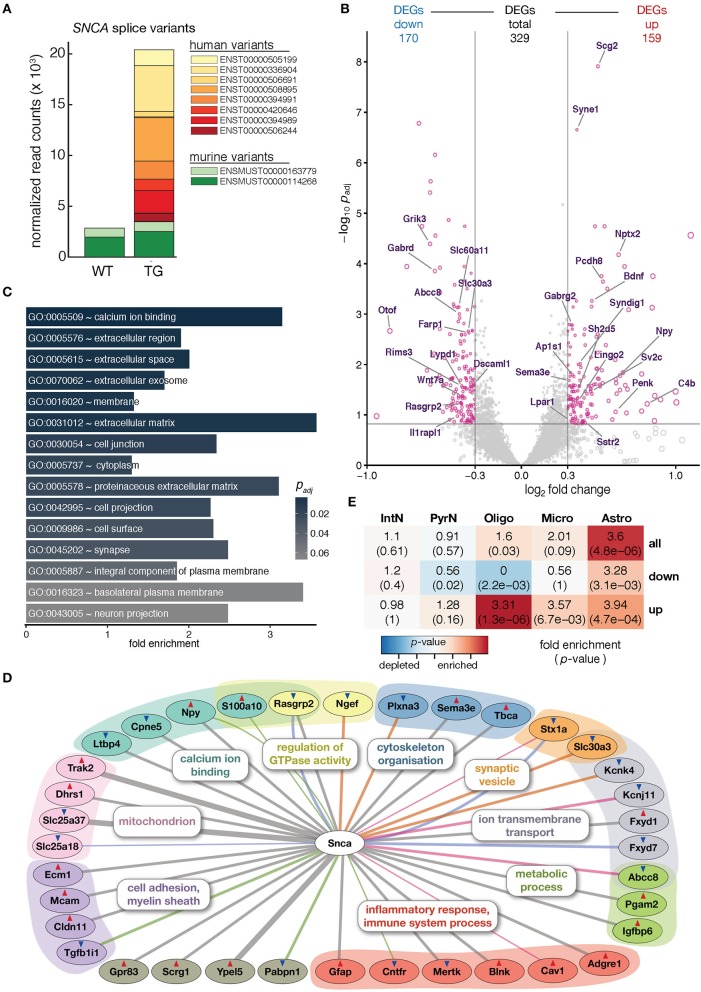
Figure 1.
Overexpression of human SNCA altered the hippocampal transcriptome. (A) Composition and expression level of murine and human SNCA splice variants in hippocampus of 12-month-old WT and TG mice. (B) Volcano plot showing differences in gene expression between hippocampi of TG and WT mice. Pink dots highlight 329 genes differentially expressed above cut-offs of padj ≤ 0.15 and | log2 FC | ≥ 0.3 indicated by dashed lines. Genes with Gene Ontology-slim annotation synapse are labeled. Only murine genes plotted; for expression changes of endogenous and human SNCA see (A). (C) Fold enrichment of overrepresented Gene Ontology terms among DEGs. (D) Known direct interactions of SNCA with 329 DEGs (n = 36). Type of interaction color-coded (gray, co-expression; pink, physical interaction; orange, MGI phenotype; green, PPI predicted; blue, co-localization). Genes arranged and colored based on Gene Ontology categories. Red and blue triangles indicate up- and downregulation of genes. (E) Cell type enrichment analysis of 329 DEGs indicating fold enrichment for genes attributed to interneurons (IntN), pyramidal neurons (PyrN), oligodendrocytes (Oligo), microglia (Micro), and astrocytes (Astro) (Zeisel et al., 2015). p-value represents significance in enrichment (red) or depletion (blue) over background by two-sided Fisher's exact test.

