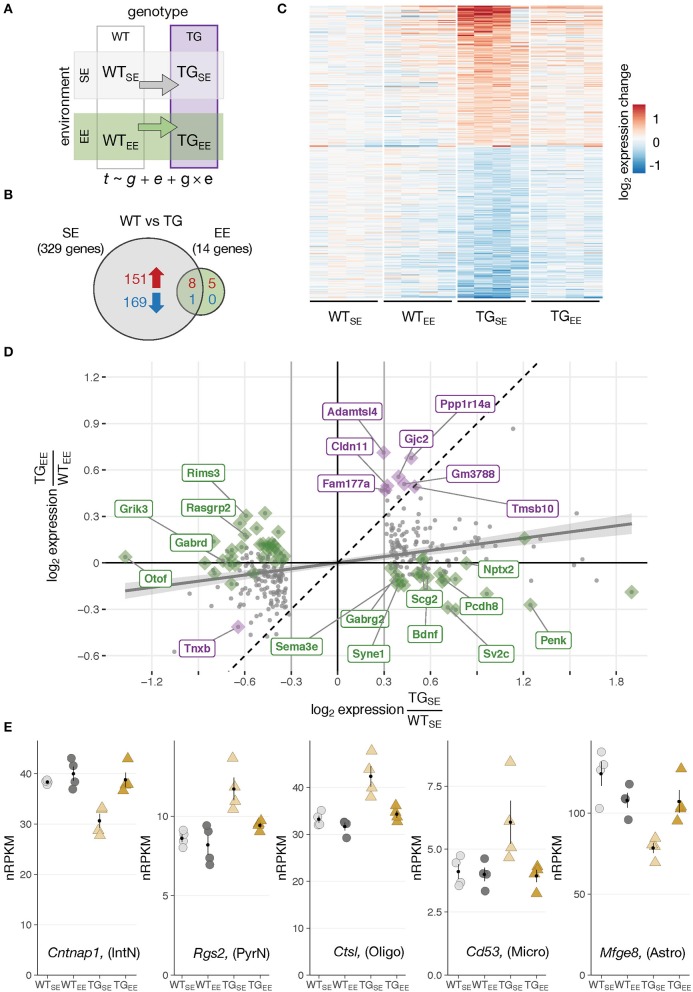
Figure 2.
Environmental enrichment prevented disturbances in gene expression. (A) Schematic diagram of four experimental groups in a 2 × 2 factorial design with two genotypes (WT, TG) and two environmental conditions (SE, EE). WTSE, wildtype mice in standard environment; WTEE, wildtype mice in enriched environment; TGSE, transgenic mice in standard environment; TGEE, transgenic mice in enriched environment. Gene expression (t) was modeled as a function of genotype (g), environment (e), and their interaction (g × e). (B) Venn diagram comparing number of DEGs between TGSE/WTSE and TGEE/WTEE. (C) Expression levels (log2 expression change relative to WTSE) across all experimental groups of 329 DEGs (TGSE/WTSE). Rows sorted by mean expression change in TGSE. (D) Scatter plot of log2 gene expression changes between WT and TG mice housed in standard (x-axis) and enriched environment (y-axis). Plotted in gray are 329 DEGs (TGSE/WTSE). Linear regression line with standard error shown in gray. Dashed line represents ordinary diagonal. Genes differentially expressed in both SE and EE labeled in purple. Dots highlighted in green indicate genes significantly affected by the environment based on the interaction term of the statistical model. (E) Expression levels in normalized reads per kilobase per million (nRPKMs) for selected genes plotted as individual data points with mean ± SEM. Assigned cell type specificity is indicated (Zeisel et al., 2015).

