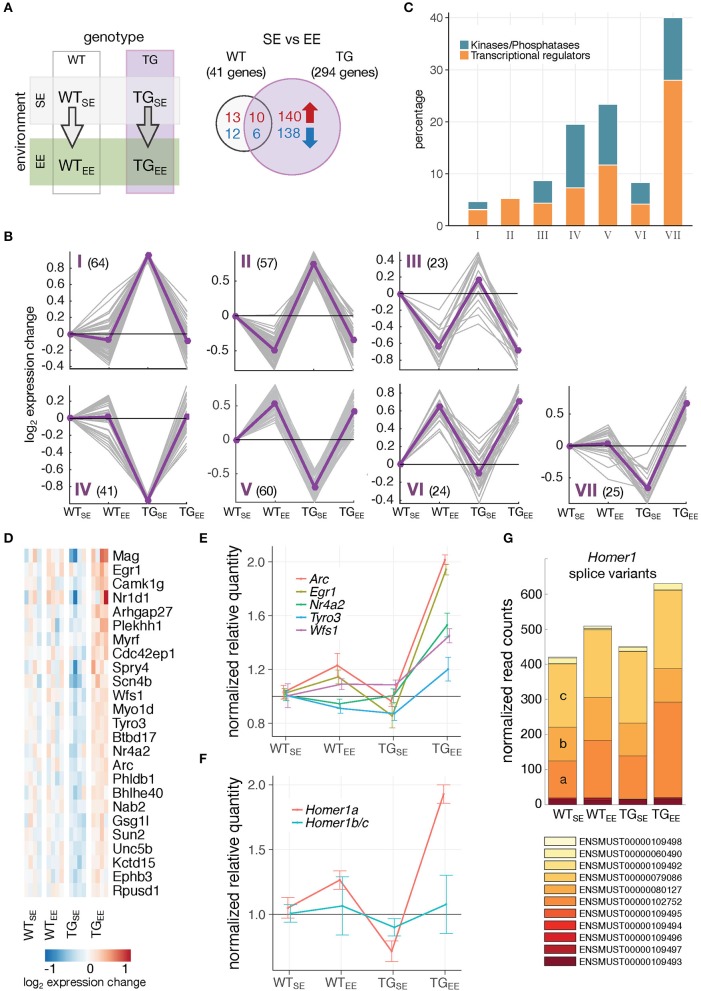
Figure 4.
Distinct gene-environment response schemes. (A) Schematic diagram of four experimental groups comparing the effect of an enriched environment in wildtype and transgenic animals. Venn diagram comparing number of DEGs between WTEE/WTSE and TGEE/TGSE. (B) Cluster analysis of the 294 DEGs from (A) using k-means on gene expression ratios relative to WTSE of all experimental groups. Subplots show gene expression changes (log2 expression change) of each gene (gray lines) and cluster centroids (purple line). Number of DEGs in each cluster indicated in brackets. (C) Percentage of DEGs associated with the Gene Ontology terms transcription regulator activity and protein kinase activity/phosphatases for each cluster identified in (B). (D) Cluster VII genes and their expression changes across all experimental groups relative to WTSE. (E) Validation of expression changes for Egr1, Nr4a2/Nurr1, Arc, Tyro3, and Wfs1 using RT-qPCR. Normalized quantities relative to WTSE (mean ± SEM) are plotted (n = 4 mice per group). For statistical details see Supplementary Table 2 and Supplementary Figure 6. (F) Validation of expression changes for splice variants Homer1a and Homer1b/c using RT-qPCR (n = 4 mice per group). Normalized quantities relative to WTSE (mean ± SEM) are shown. For statistical details see Supplementary Table 2. (G) Composition and expression level of Homer1 splice variants across experimental groups.

