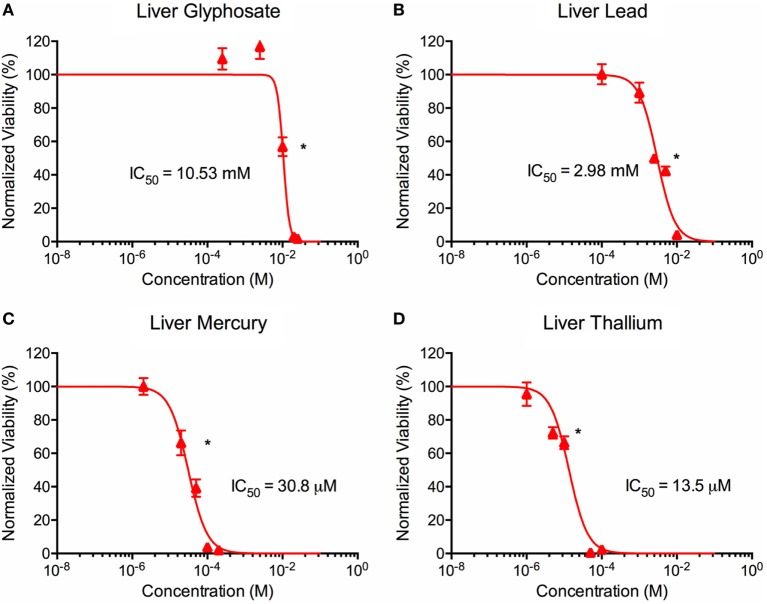
Figure 3.
Environmental toxin effects on liver organoid ATP activity. ATP survival curves for liver organoids exposed to glyphosate (A), lead (B), mercury (C), and thallium (D) over the course of two days. Adjusted ATP activity is a comparison of the ATP value of organoids exposed to toxins over the control liver organoids. Statistical significance: *p < 0.01 with bracket encompassing all doses with this value. IC50 value was determined through calculation of line crossing the IC50 marker.

