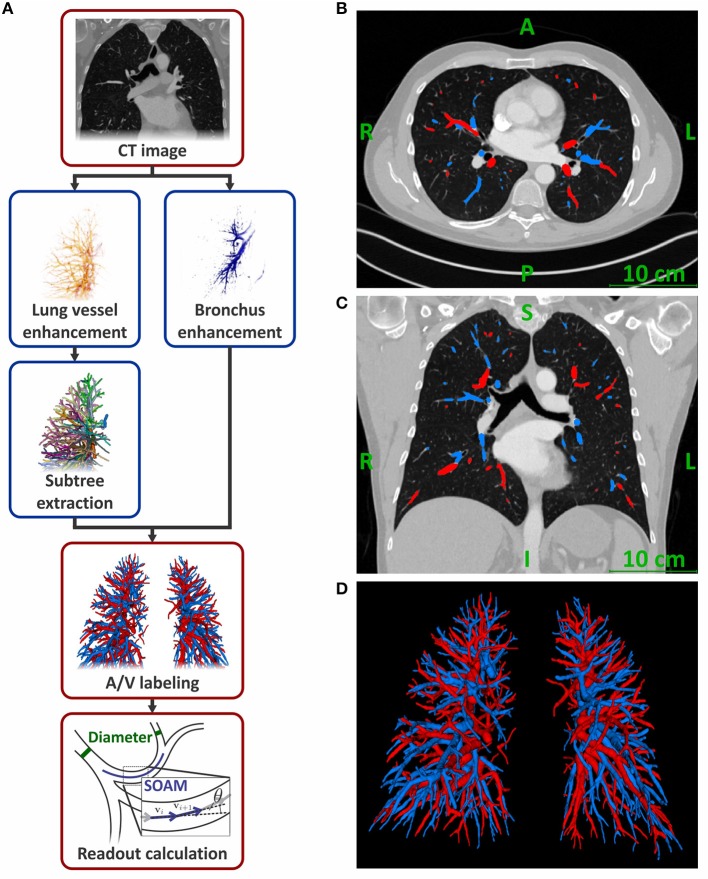
Figure 1.
Flowchart of the fully-automatic artery/vein separation algorithm (A). Representative computed tomography pulmonary angiography images in transversal (B) and coronal (C) plane of a male subject with automatically labeled arteries and veins. Representative 3D rendering of the detected vessel trees from the same subject (D). Arteries are colored blue; veins are colored red.

