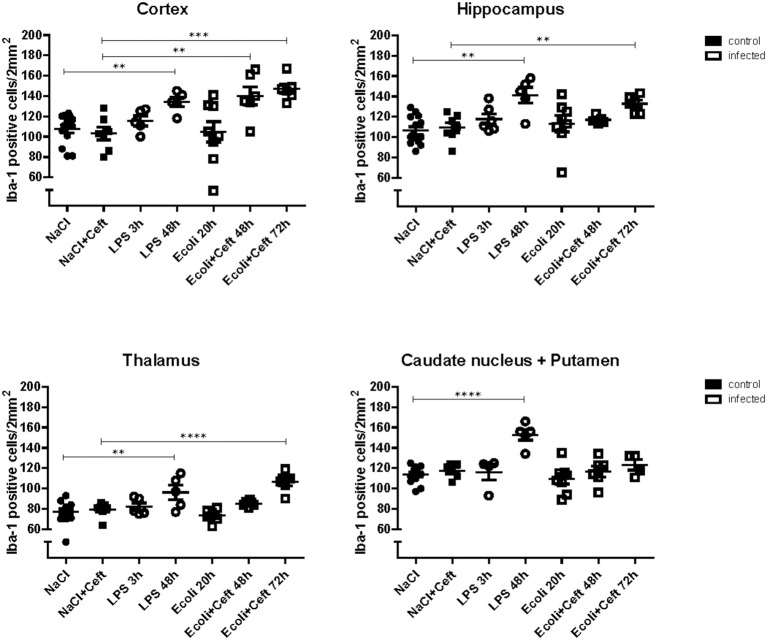
Figure 1.
Histopathological counts of microglia. Number of Iba-1 positive microglial cell bodies per group (NaCl: n = 13, NaCl+Ceft: n = 7, LPS 3 h: n = 5, LPS 48 h: n = 5, E. coli 20 h: n = 8, E. coli+Ceft 48 h: n = 6, E. coli+Ceft 72 h: n = 6), in different brain regions (cortex, hippocampus, thalamus, and caudate nucleus+putamen), per 2 mm2.Data represent mean ± SEM, **P ≤ 0.01, ***P ≤ 0.001, ****P ≤ 0.0001.

