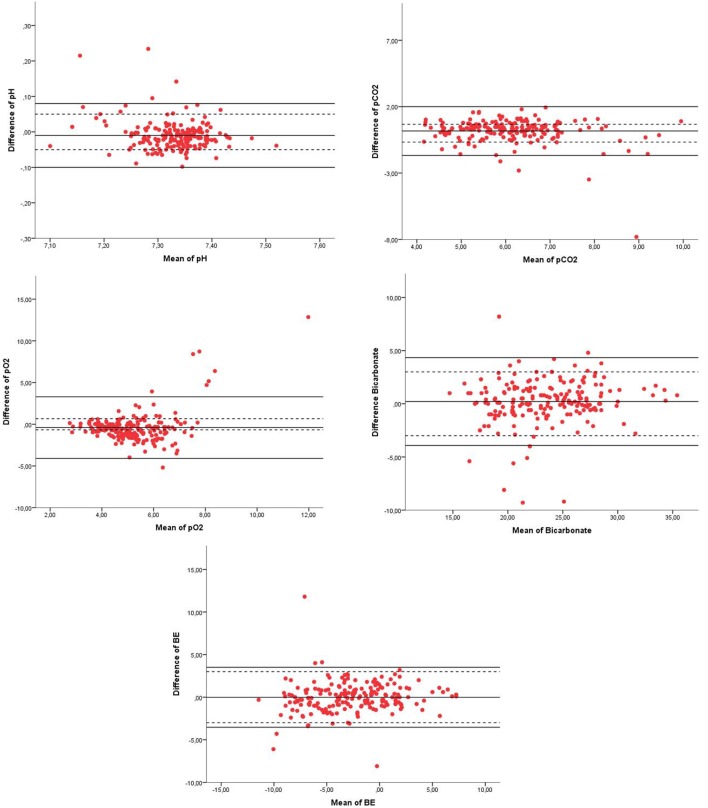
Figure 2.
Bland–Altman plots of pH, pCO2, pO2, bicarbonate, and BE of venous blood gas (VBG) and capillary blood gas (CBG). Legend of the Bland–Altman plots: X = mean of pH, pCO2 (kpa), pO2 (kpa), bicarbonate (mmol/1), or BE (mmol/1), Y = difference of the parameter of pH, pCO2 (kpa), pO2 (kpa), bicarbonate (mmol/1), or BE (mmol/1), red dots = measurement of each paired sample of VBG and CBG, solid black line = 95% confidence interval limits, and dotted line = clinical acceptable absolute difference.

