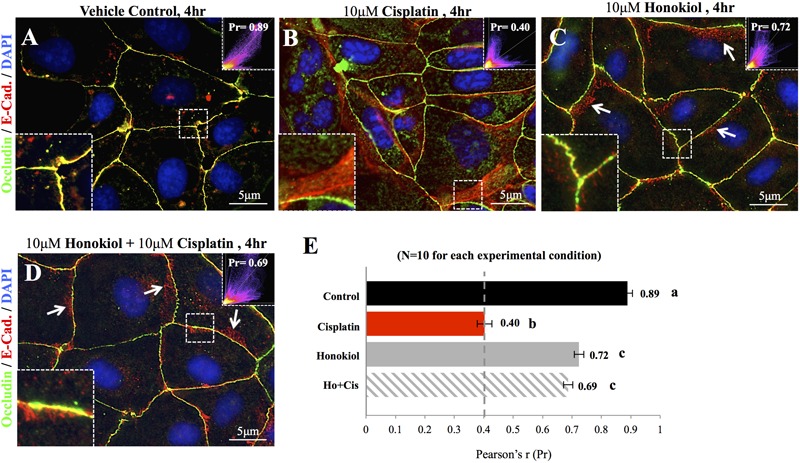
FIGURE 2.

Co-localization analyses of E-Cadherin and Occludin. Co-localization of E-Cadherin (in red) and Occludin (in green) was analyzed on flat cell culture. Co-localization of two proteins can be visualized in yellow and quantified with Pearson’s correlation coefficient (Pr) from 10 randomly took images in each group (E). (A) Control cells showed high degree of co-localization with Pr value of 0.89, (B) When cells were treated with 10 μM cisplatin, both Occludin (in green) and E-Cadherin (in red) can be detected in the cytosol. Enlarged imaged showed the movement of E-Cadherin from the lateral membrane into the cytosol. Pr value decreased from 0.89 in control cells to 0.4 in cisplatin-treated cells indicated the decreased in co-localization of two signals. (C,D) When HNK alone (C) or was co-incubated with cisplatin (D), Pr value increased from 0.4 to 0.72 and 0.69, respectively, indicated an increased co-localization of E-Cadherin and Occludin. Enlarged magnification showed a minor degree of E-Cadherin (in red) moved away from the lateral membrane and these redistributed signals exhibited in punctate vesicle-like signals (indicated with arrows). Images presented were representative images, and at least 10 images from each group were taken randomly and assessed. a–c indicated significant (p < 0.05) difference between groups.
