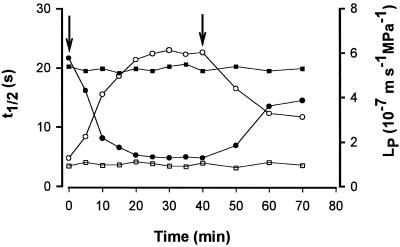
Figure 2.
Time course of changes in t1/2 (□, ○) and LP (▪, •) of one root cell in response to 100 μm HgCl2 in the bathing medium (circles) or in control solution (squares). The first arrow indicates addition of 100 μm HgCl2 to the bathing medium, and the second arrow indicates removal of HgCl2 by 5 mm β-mercaptoethanol.

