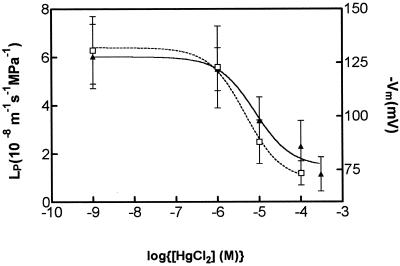
Figure 3.
Dose-response curves of Vm (▴) and LP (□) to HgCl2 concentrations in the bathing medium for root cortex cells. The values are means ± sd of 6 to 10 cells and have been fitted by sigmoidal dose-response curves of the form: y = ymax + (ymax − ymin)/(1 + 10(logEC50 − log[HgCl2 concentration]). The half-maximal inhibition constants (EC50) for LP and Vm were 4.6 and 7.8 μm, respectively.

