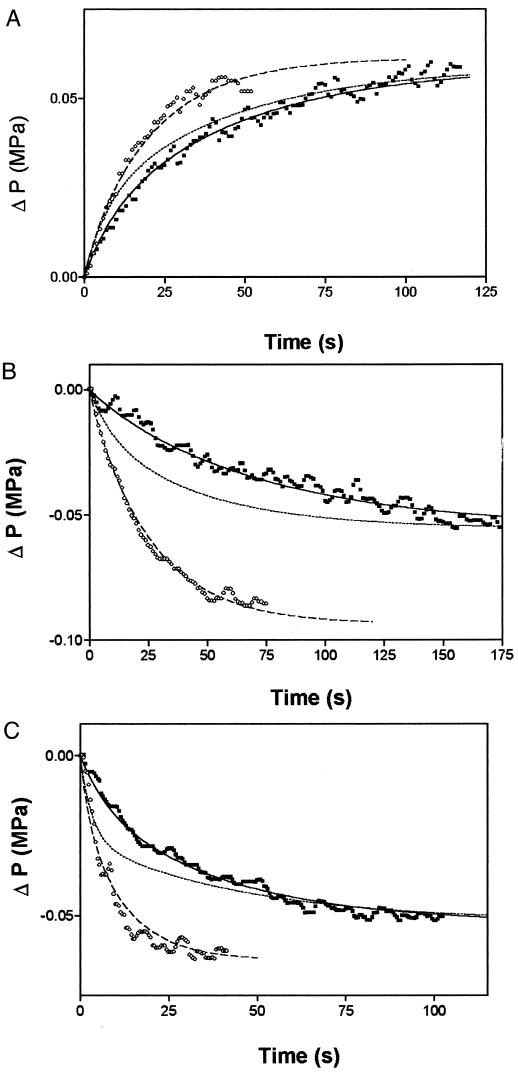
Figure 4.
Examples of P relaxation curves for three cells before and after HgCl2 treatment. A, Cell no. 1412; B, cell no. 287; and C, cell no. 58. The fitted lines were generated from the three-compartment model of Wendler and Zimmermann (1985). The cell numbers correspond to those in Table II. Open symbols, Control; closed symbols, plus HgCl2; dashed lines, control fit; dotted lines, tonoplast inhibited; solid lines, plasma membrane and tonoplast inhibited.

