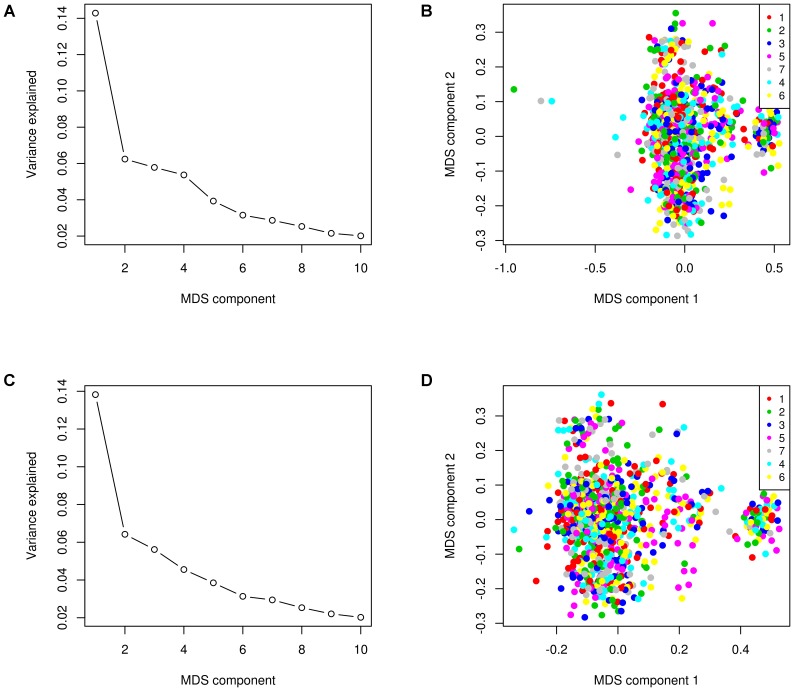
FIGURE 1.
Multidimensional scaling (MDS) plot of identity-by-state (IBS) matrix. Genomic variance explained by the first 10 MDS components before (A) and after (C) removing genetic outlier animals. The MDS plot before (B) and after (D) removing the three genetic outlier animals shows the population structure within herds (distinguished by color) identified by the first two dimensions.

