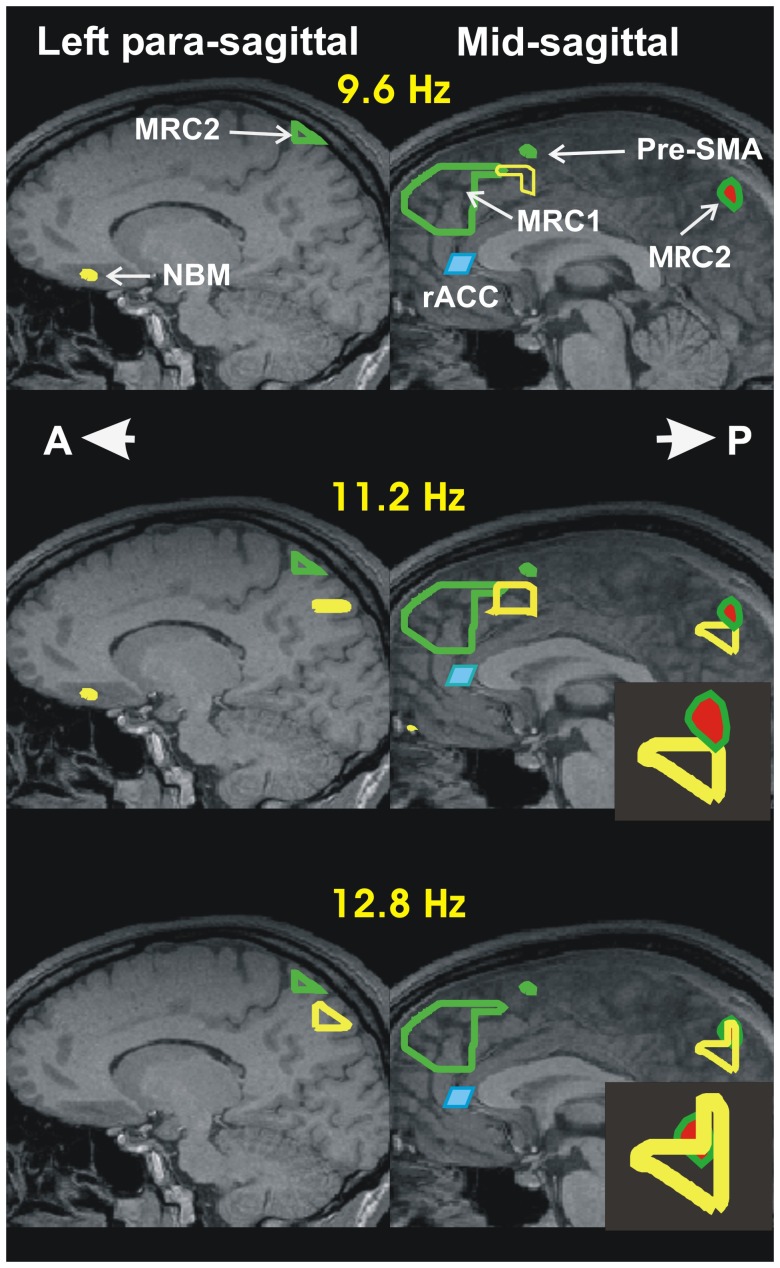
FIGURE 1.
Summary of accommodation related results from our two recent sleep studies: I- Increase in activity during spindles relative to MSRC. The results are displayed in the left paramedial (left column) and mid (right column) sagittal planes. The continuous green outlines are the boundaries of the areas with highest spectral gamma band power, during the quiet periods of REM (Ioannides et al., 2009). It is these two areas that are identified as the two main nodes of the MSRC core of the DMN. The node in the frontal lobe, MSRC1, is captured only in the mid sagittal slice. The node in the posterior parietal cortex, MSRC2, is captured in the paramedial slide and in the mid-sagittal slice (the red filling indicates that it is identified at slightly lower significance). The changes during spindles are presented by the yellow outlines showing the areas of increased activity in the comparison between NREM2 core periods and the 2 s beginning with the start of spindles. The increase in power is confined to the alpha and sigma bands (8–16 Hz). For the Figure the increases are computed independently in three frequency ranges each one 3.2 Hz wide, with center frequencies at 9.6, 11.2, and 12.8 Hz and displayed in the top, middle and lower rows, respectively. Before and during spindles (and KCs) only increases in activity are seen compared to the NREM2 core period. The activations seen in the figure in the alpha and sigma band are the main activations seen during spindles. The figure shows the increases in three main areas: In the frontal areas increases in the alpha and low sigma frequency bands are seen in two areas, one dorsally (just caudal to MSRC1 in the mid-sagittal slice) and the other ventrally in the paramedial slice in the basal forebrain close to the nucleus basalis of Meynert (NBM). The third area shows increase in the high alpha and sigma bands and it is located in the posterior parietal cortex. In the paramedial slice (last two rows on the left column) it is distinct from, and clearly below MSRC2. In the mid-sagittal slice it is just below, and still distinct from, MSRC2 in the high alpha band (second row). In the low and high (not shown in the figure) sigma band an additional activation is seen that overlaps with the MSRC2. These details of the mid-sagittal activations are easier to see in the enlarge icons in the second and third row of the second column. The shaded blue parallelogram directly below MSRC1, just in front of the knee of the corpus callossum, is the rostral anterior cingulate cortex (rACC); in the awake state, this area is responsible for monitoring the environment. The results we reported recently (Ioannides et al., 2017), suggests that rACC plays a similar role during sleep. Specifically, this area is inhibited at the start of light sleep, as part of the general increase in delta in NREM1, but it increases its activity in the NREM2 core period in the alpha and low sigma bands, but actively inhibited (increase in delta) in the two seconds before spindles, but not KCs, for details see panoramic view of these changes in Figure 4 of (Ioannides et al., 2017).

