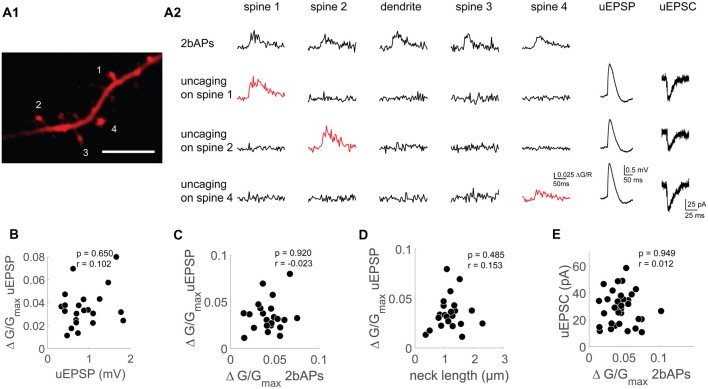
Figure 3.
Functional uncoupling between bAP Ca2+ transients, uEPSP mediated Ca2+ transients and AMPAR-mediated uEPSCs on the single spine level. (A1) Z-projection of the imaged dendritic segment. Scale bar: 2 μm. (A2) Doublet evoked bAP-Ca2+ transients (2bAPs), uncaging evoked Ca2+ transients with corresponding uEPSPs and uEPSCs, spines are marked in (A1). Doublet evoked bAP-Ca2+ transients and uncaging evoked Ca2+ transients were also recorded in the adjacent dendritic segment. (B) Scatter plot of uEPSPs vs. uncaging evoked Ca2+ transients. Statistics: spearman correlation. (C) Scatter plot of doublet evoked Ca2+ transients and uncaging evoked Ca2+ transients. Statistics: spearman correlation. (D) Correlation of neck length and uncaging evoked Ca2+ transients. Statistics: spearman correlation. (E) Correlation of doublet evoked Ca2+ transients and uEPSCs. Statistics: spearman correlation.

