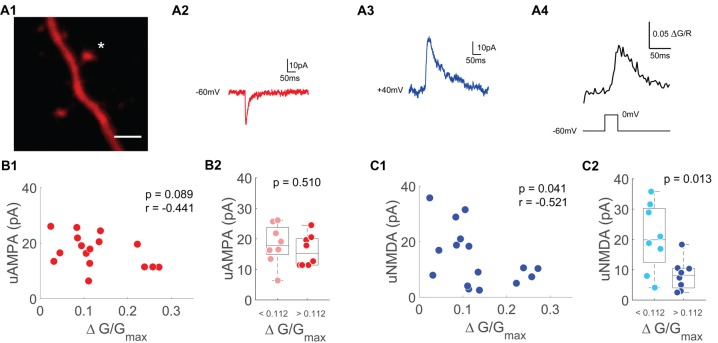
Figure 4.
Single spine uNMDA EPSCs are negatively correlated with depolarization induced spine Ca2+ transients. (A1) Z-projection of the imaged spine (marked with an asterisk). Scale bar: 2 μm. (A2) Averaged example trace of an uncaging evoked current at −60 mV. (A3) Averaged example trace of an uncaging evoked current at +40 mV. (A4) Averaged Ca2+ transients evoked by a depolarization step from −60 mV to 0 mV for 30 ms. (B1) Scatter plot of depolarization step evoked Ca2+ transients and uncaging evoked currents at −60 mV (uAMPA). Statistics: spearman correlation. (B2) Median box plot of uAMPA-EPSC amplitudes of spines with smaller (light red) and larger (red) depolarization mediated VGCC Ca2+ transients grouped by the median. Statistics: t-test. (C1) Scatter plot of depolarization step evoked Ca2+ transients and uncaging evoked currents at +40 mV (uNMDA) measured 50–60 ms after onset. Statistics: spearman correlation. (C2) Median box plot of uNMDA-EPSC amplitudes of spines with smaller (light blue) and larger (blue) depolarization mediated VGCC Ca2+ transients grouped by the median. Statistics: t-test.

