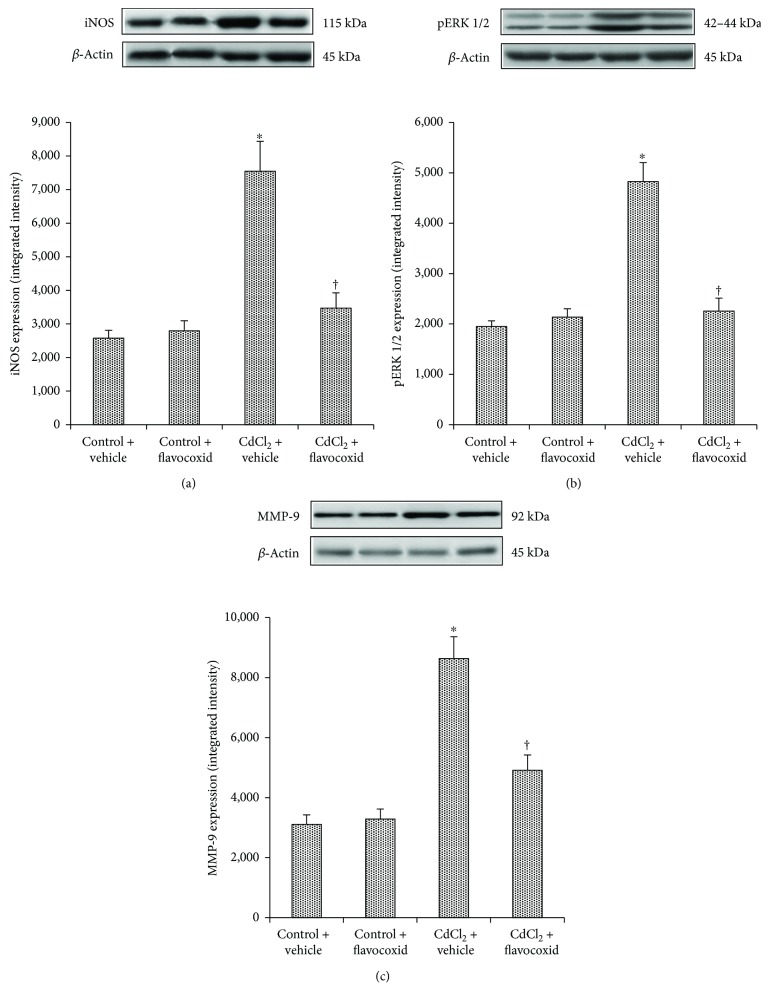
Figure 1.
Representative Western blot analysis of iNOS (a), pERK 1/2 (b), and MMP-9 (c) of kidneys from mice of control plus vehicle (0.9% NaCl), control plus flavocoxid (20 mg/kg/day i.p.), CdCl2 (2 mg/kg/day i.p.) plus vehicle, and CdCl2 plus flavocoxid groups. ∗p < 0.05 versus both controls and †p < 0.05 versus CdCl2 plus vehicle. Bars represent the mean ± SE of seven experiments.

