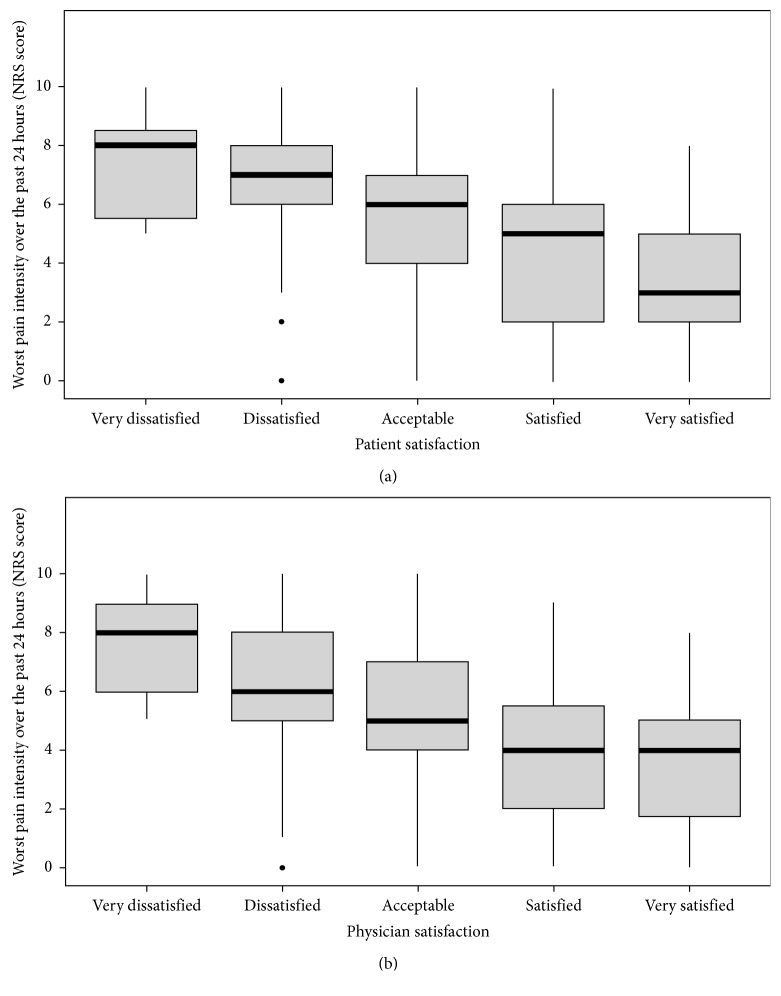
Figure 1.
Box plots showing patients' worst pain intensity over the past 24 hours and (a) patients' and (b) physicians' satisfaction with patients' pain control. Horizontal line within the box plot indicates the median; boundaries of the box represent the 25th- and 75th-percentile; filled symbols denote outliers.

