Figure 1.
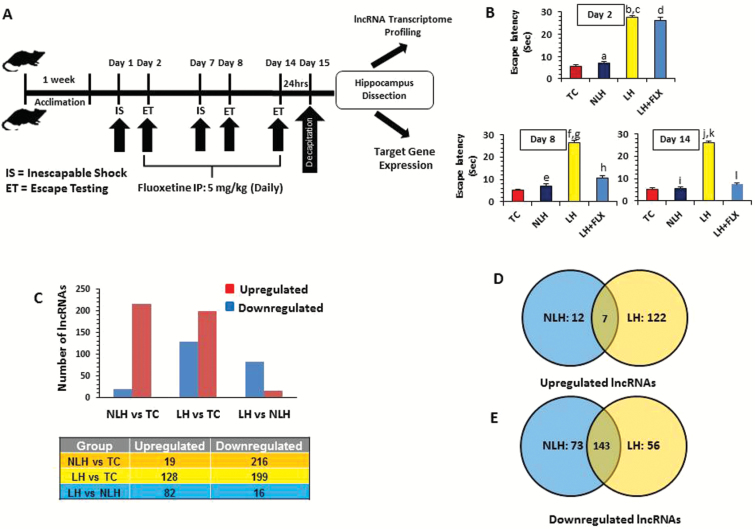
Stress-induced learned helplessness (LH) model of depression and associated transcriptome-wide changes in long noncoding RNA (lncRNA) expression. (A) Schematic diagram of the timeline followed as part of the stress paradigm to induce the LH behavior in rats. The schematic diagram also represents the timeline followed as part of the fluoxetine treatment paradigm to test the antidepressant effect on LH behavior. (B) The bar diagrams represent escape latencies in tested controls (TC), nonlearned helplessness (NLH), LH, and LH treated with fluoxetine (LH+FLX) rats measured on days 2, 8, and 14. Data are the mean±SEM. On day 2, the NLH rats did not show any significant (aP=.30) difference in escape latency compared with the TC group. A significantly (bP<.001) higher escape latency was observed for LH rats compared with TC on day 2. Similarly LH rats showed significant difference (cP<.001) in mean escape latency compared with the NLH group on day 2. No significant difference was found (dP=.250) when LH+FLX rats were compared with LH rats on day 2. On day 8, NLH rats did not show any significant (eP=.182) difference in escape latency compared with the TC group. A significantly (fP<.001) higher escape latency was noted for LH rats compared with TC rats. Similarly, LH rats showed significant difference (gP<.001) in mean escape latency compared with the NLH group. Comparison on day 8 demonstrated a significant mean escape latency difference in LH+FLX vs LH groups (hP<.001). On day 14, NLH rats did not show any significant (iP=.744) difference in escape latency when compared with the TC group. Individual group comparison identified a significantly (JP<.001) higher escape latency for LH rats compared with TC rats. Similarly, LH rats showed significant difference (kP<.001) in mean escape latency compared with the NLH group. On the other hand, individual comparison on day 14 demonstrated a significant mean escape latency difference in LH+FLX vs LH groups (lP<.001). (C) Bar diagram showing group-wise distribution of differentially regulated lncRNAs, which includes both up- and downregulated sets. The table under the diagram represents the actual number of lncRNAs associated with up- and downregulated sets from each comparison group (TC, NLH, and LH). (D) Venn diagram showing the overlapping sets of upregulated lncRNAs found to be common for both NLH and LH groups. The diagram is also representative of uniquely upregulated lncRNAs in reference to changes associated with the NLH or LH group. (E) Venn diagram shows the overlapping sets of downregulated lncRNAs found to be common for both NLH and LH groups. The diagram is also representative of uniquely downregulated lncRNAs in reference to changes associated with NLH and LH groups.

