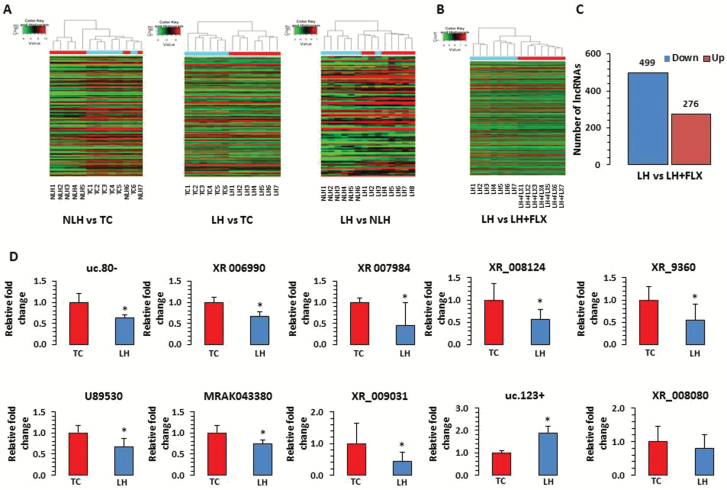
Figure 2.
Expression related changes in long noncoding RNAs (lncRNAs) associated with a rat model of depression. (A) Hierarchical clustering of lncRNAs represents group-wise (nonlearned helplessness [NLH] vs tested controls [TC], learned helplessness [LH] vs TC, and LH vs NLH) expression variability in fold change as plotted with heat map. Individual samples are represented in each column, whereas each row demonstrates lncRNAs. According to the color scheme, red indicates upregulation and green indicates downregulation. (B) Hierarchical clustering of lncRNAs representing the LH vs fluoxetine group is demonstrated with microarray based expression heat map. (C) Bar diagram shows group-wise (LH vs LH rats treated with fluoxetine [LH+FLX]) distribution of differentially regulated lncRNAs including both up- and downregulated sets. The actual number of lncRNAs associated with up- and downregulated sets from the comparison group (LH vs LH-FLX) are indicated on top of each representative bar. (D) qPCR-based expression validation of lncRNA transcripts uc.80-, XR_006990, XR_007984, U89530, MRAK043380, XR_009031, XR_008124, XR_9360, uc.123+, and XR_008080 were analyzed in LH rats using primers mentioned in the Methods section. Gapdh-normalized expression level for each transcript is presented as relative fold change. All data are the mean±SEM. The level of significance was determined using independent-sample t test. *Significant difference between 2 compared groups (uc.80-, P=.01; XR_006990, P=.005; XR_007984, P=.05; U89530, P=.02; MRAK043380, P=.02; XR_009031, P=.05; XR_008124, P=.03; XR_9360, P=.05; uc.123+, P=.01; and XR_008080, P=.30).

