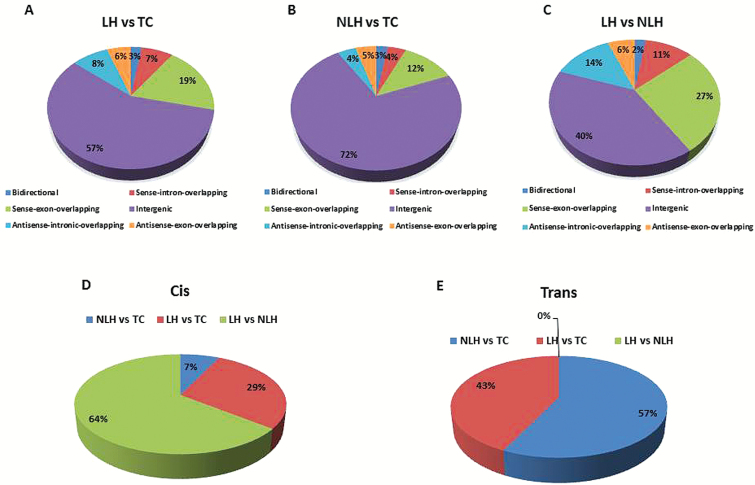
Figure 3.
Class distribution of differentially expressed long noncoding RNAs (lncRNAs) and their predicted target genes across tested control (TC), nonlearned helplessness (NLH), and learned helplessness (LH) groups. (A-C) Distribution of lncRNA classes based on their relative position to protein coding genes on chromosome are represented as pie charts for each pair-wise compared group. Each segment of pie chart is represented with 6 different classes of lncRNAs for their relative genomic context. (D-E) Pie diagrams represent the relative distribution of predicted target genes of differentially regulated lncRNAs based on the cis and trans acting role as identified from pair-wise comparison of 2 groups.

