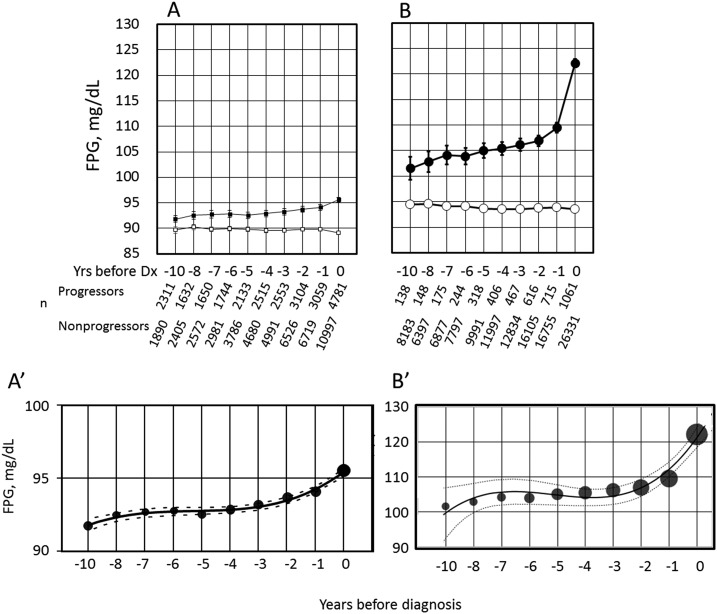
Figure 2.
Trajectories of FPG before (A) PDM and (B) diabetes and weighted cubic regression of the estimated marginal means of FPG trajectory before (A′) PDM and (B′) diabetes. (A and B) Values in the progressors and nonprogressors at each time point were all significantly different (P < 0.01). (A) PDM-Progressors (▪) and NGR-Nonprogressors (□); (B) DM-Progressors (●) and NDM-Nonprogressors (○). The axis scale was intentionally maintained the same to facilitate visual comparison. (A′ and B′) The sizes of the circles are proportional to the number of individuals. The lines are the best-fit cubic regression, and broken lines indicate 95% confidence intervals. Dx, diagnosis; n, number of participants examined each year; Yrs, years.

