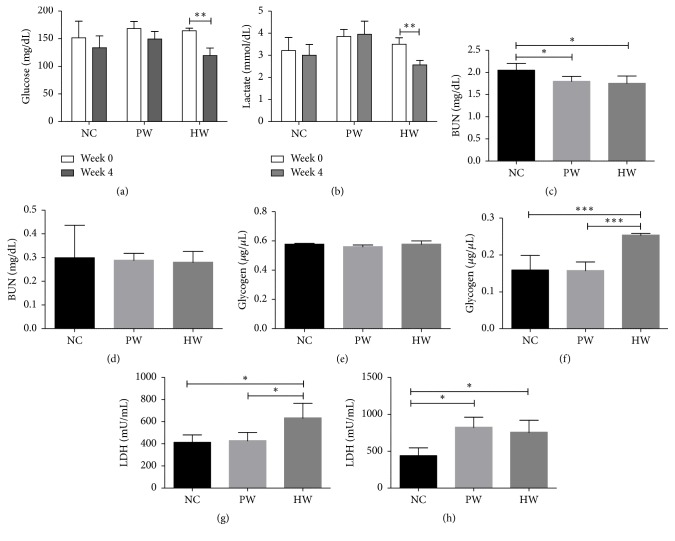
Figure 2.
Metabolic activities. Blood glucose (a) and blood lactate (b) levels between wk 0 and wk 4, BUN in serum (c) and liver lysate (d), glycogen in serum (e) and liver lysate (f), and LDH level in serum (g) and liver lysate (h). Data were expressed as mean ± SD, n = 7. ∗p < 0.05, ∗∗p < 0.01, and ∗∗∗p < 0.001. NC: normal control group, PW: stressed group treated with purified water, and HW: stressed group treated with hydrogen water.

