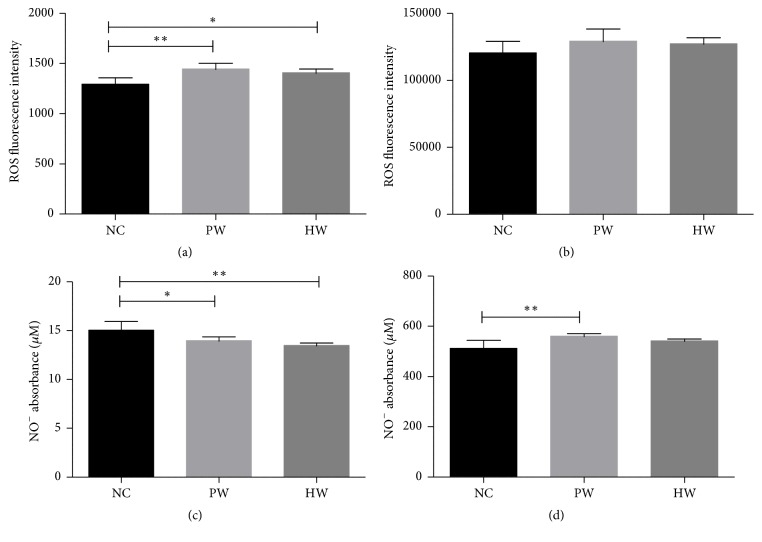
Figure 3.
ROS and NO production. ROS level in serum (a) and liver lysate (b) and NO level in serum (c) and liver lysate (d). Data were expressed as mean ± SD, n = 7. ∗p < 0.05, ∗∗p < 0.01. NC: normal control group, PW: stressed group treated with purified water, and HW: stressed group treated with hydrogen water.

