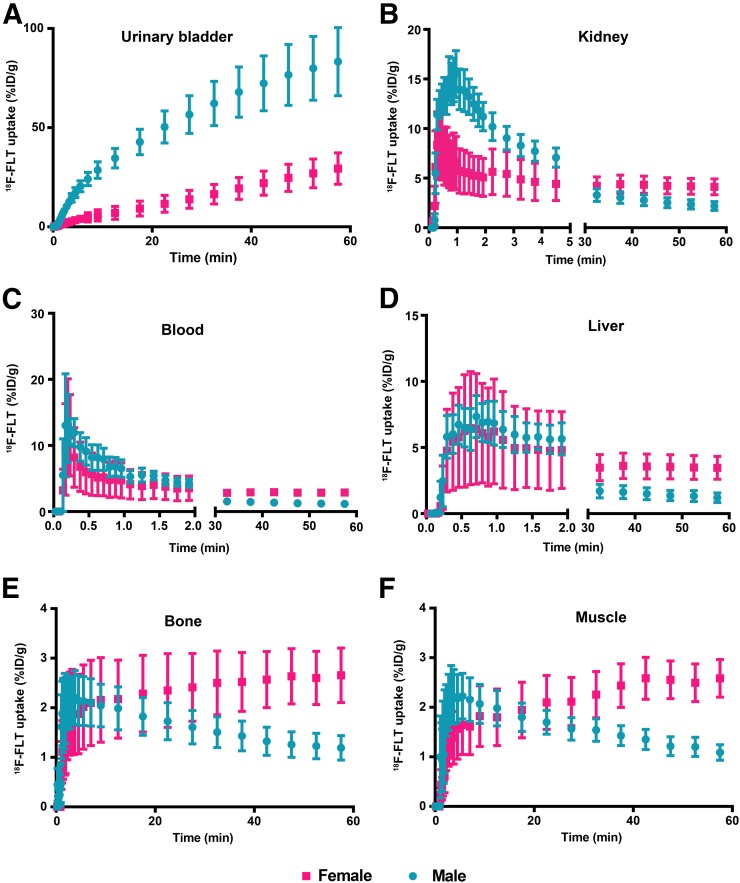
FIGURE 3.
Time–activity curves for 18F-FLT in male and female athymic nude mice imaged using dynamic PET from 0 to 60 min after injection of approximately 0.93 MBq (25 μCi) of 18F-FLT. Regions of interest were drawn, and time–activity curves determined, for urinary bladder (A), kidney (B), blood (C), liver (D), bone (E), and muscle (F).

