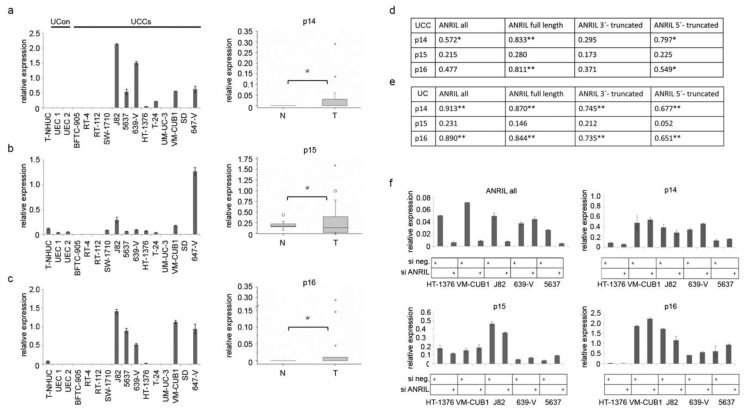
Figure 3.
(a–c) Expression profiles of the three TS from the INK4/ARF locus were generated by qRT-PCR in UCCs (left panels) and tissue set 1 (boxplot graphs right panel; * p ≤ 0.05; T: n = 19; N: n = 10). Expression of different ANRIL variants was correlated with expression of the three TS in cell lines (d) and tissues (e) (** p ≤ 0.01; * p ≤ 0.05). (f) Knockdown of full length and truncated ANRIL variants by siRNA (top left panel) did not result in significant expression changes of the three TS in four different UCCs. SiRNA knockdown of ANRIL in 639-V cells was less efficient.

