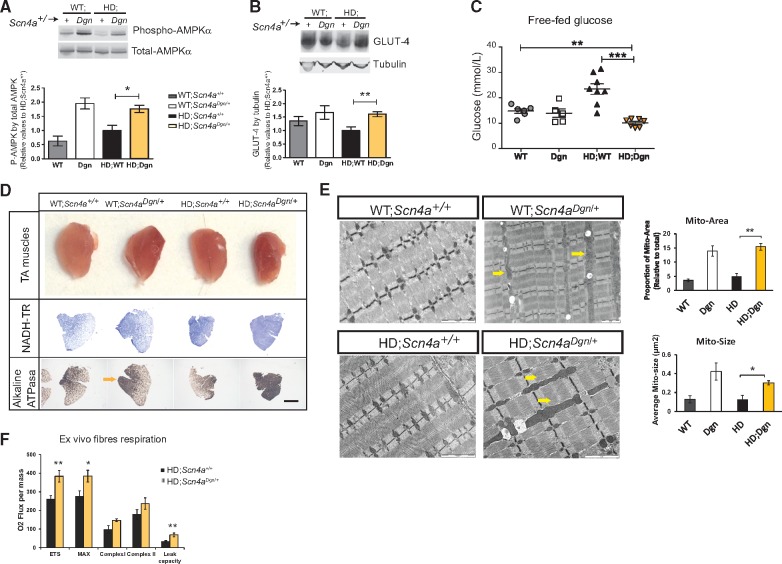
Figure 2.
HD muscles carrying Scn4a mutation showed adaptive changes to higher energy demands. All analysis from male TA muscle at 12 weeks of age, unless stated otherwise. (A and B) Immunoblot of AMPKα activation levels measured via the ratio of Thr321 phosphorylated AMPK versus total AMPKα (A), and glucose transporter (GLUT-4) protein levels corrected by tubulin (B), (n = 3 nonHD; n = 4 HD groups). (C) Free-fed circulating levels of glucose. (D) Representative images of whole muscle (first row) and sections. Second and third panel rows show comparable TA transversal sections stained with NADH-TR and Alkaline ATPasa activity, showing oxidative fibre grouping in HD; Scn4aDgn/+ (yellow arrow). (E) Representative TEM muscle micrographs. Arrows point to the appearance of enlarged mitochondria. Scale bar represents 2 µm. Quantification of the average mitochondria area and size in TEM. Each bar represents the average of n = 3–5 mice per group and at least five comparable TEM per mouse. (F) Analysis of mitochondrial respiration (Oxygen Consumption Rate (OCR)) ex vivo from permeabilized fibre bundles of EDL muscle using high resolution respirometry (n = 5). Graph bars represent mean ± SEM and values are relative to the average HD; Scn4a+/+ group value. *P< 0.05, **P < 0.01, ***P < 0.001.

