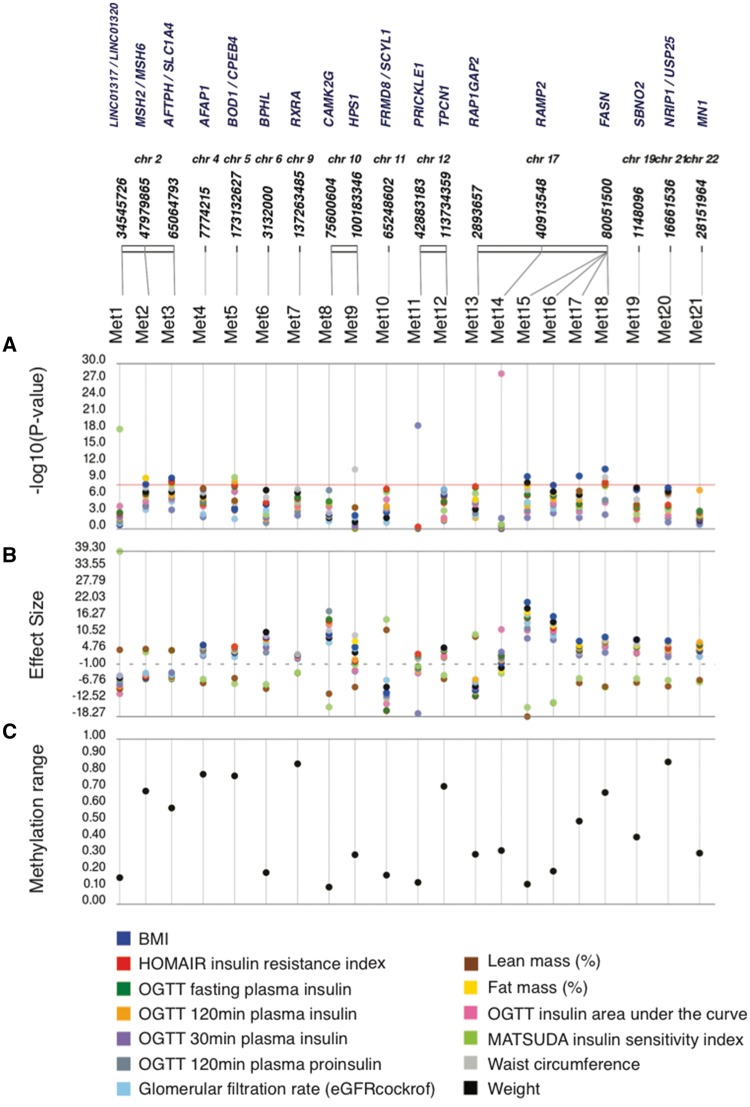
Figure 1.
Epigenome-wide association of metabolic clinical traits. Association between DNA CpG methylation and clinical traits. (A) “PheWAS” plot showing association of each of the methylation loci (Met 1–21) and the clinical traits. The genomic location of the CpG is on the x-axis and the association significance is on the y-axis. Different colors represent different traits. (B) The effect size for each association shown in (A). (C) For each methylation locus on the x-axis, the range of methylation across individuals in the population is shown on the y-axis.

