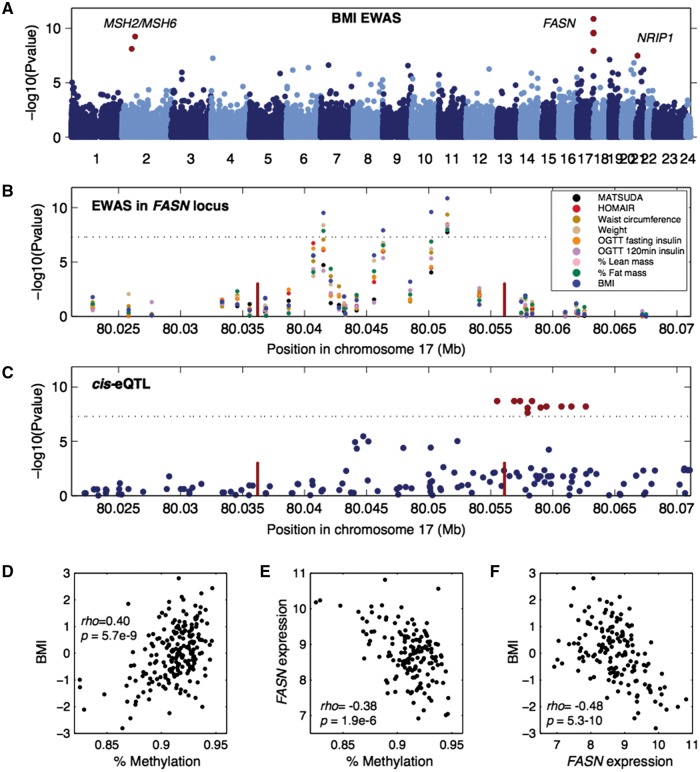
Figure 2.
FASN is associated with multiple clinical traits. (A) Manhattan plot showing EWAS results for BMI. Each dot represents a CpG region with the genomic location of each CpG region on the x-axis and chromosomes shown in alternating colors. The association significance is on the y-axis and significant hits are shown as red dots. (B) Association results for multiple phenotypes near the FASN locus. Each dot represents a different association to a CpG region and different colored points represent distinct clinical traits. The genomic location of each CpG region is on the x-axis and the association significance is on the y-axis. Red vertical bars denote the transcription start and end of FASN. The dotted significance threshold line is drawn at 5 × 10⁻⁸. (C) cis-eQTL results for FASN expression in adipose tissue biopsies. Each dot represents a SNP. The genomic location of each SNP is on the x-axis and the association significance is on the y-axis. Significant SNPs are shown as red dots. Red vertical bars denote the transcription start and end of FASN. The dotted significance threshold line is drawn at 5 × 10⁻⁸. (D–F) Each point represents an individual in the cohort, showing correlation between (D) methylation levels for the peak associated CpG region and BMI, (E) methylation levels for the peak CpG region and expression of FASN and (F) expression of FASN and BMI.

