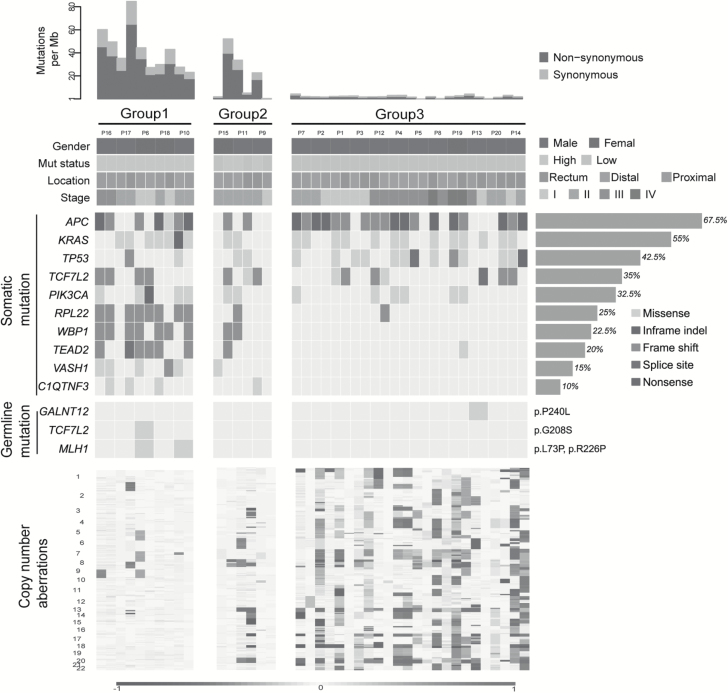
Figure 1.
Landscape of genomic aberrations in syCRCs. Each column represents a tumour; contiguous tumours are syCRCs from one patient. The top panel shows the number of somatic mutations. Group 1 comprised patients in whom both syCRCs are hypermutated. Group 2 comprised patients in whom one tumour is hypermutated, but the other is non-hypermutated. Group 3 comprised patients in whom both syCRCs are non-hypermutated. The next panel presents patients’ information including tumour location, stage, gender and mutation status (Mut status). The middle panel presents the frequently mutated genes in our cohort study, and the frequency is shown on the right. Germline mutations of common CRC-related hereditary genes are also shown (specific mutations are on the right). The bottom panel indicates the somatic copy number aberrations.

