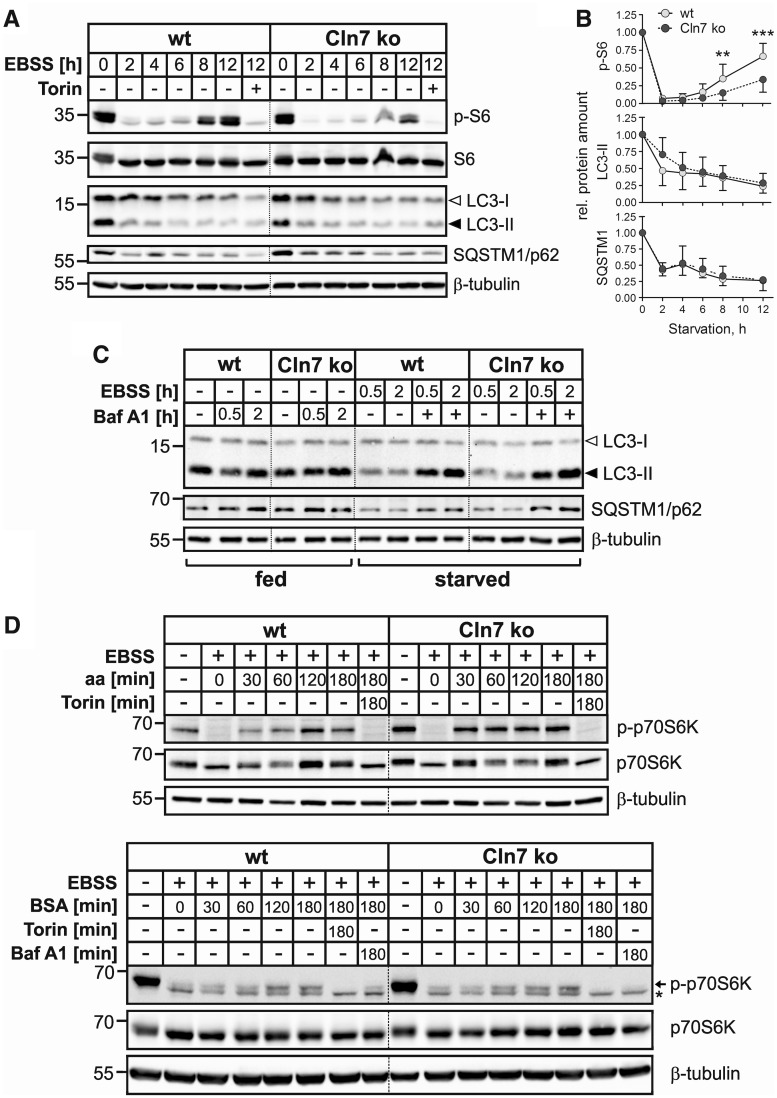
Figure 5.
mTORC1 reactivation upon starvation is impaired in Cln7 ko MEFs. (A) Wild-type (wt) and Cln7 ko MEFs were either incubated in the presence of serum and amino acids for 12 h or starved for 2, 4, 6, 8 or 12 h in amino acid-deficient EBSS medium lacking serum. MEFs starved in EBSS in the presence of the mTOR inhibitor torin 1 for 12 h were used as controls. Total cell extracts were prepared and analysed by phospho-S6 (p-S6; Ser235/236), S6, LC3 and SQSTM1/p62 immunoblotting. Equal loading was confirmed by β-tubulin western blotting. The positions of the molecular mass markers are indicated. (B) Densitometric analysis of the immunoreactive band intensities shown in (A). Data from at least three independent experiments were analysed. Results are shown as mean ± SD. ***P < 0.001, **P < 0.01 (two-tailed Student’s t-test). (C) Wild-type and Cln7 ko MEFs were incubated either in complete culture medium (fed) containing bafilomycin A1 (Baf A1, 100 nm) or in amino acid- and serum-free EBSS medium in the absence or presence of Baf A1 (starved) for 0.5 or 2 h. Total cell extracts were analysed by LC3 and SQSTM1/p62 immunoblotting. β-Tubulin immunoblotting was used as loading control. The positions of the molecular mass markers are indicated. (D) Wild-type and Cln7 ko MEFs were starved for amino acids and serum in EBSS medium for 1 h. Cells were either harvested or mTORC1 was re-activated by DMEM containing amino acids (aa, upper panel) or EBSS containing 3% (w/v) BSA (lower panel) for 30, 60, 120 and 180 min. MEFs incubated in DMEM in the presence of the mTOR inhibitor torin 1 (upper panel) or incubated in EBSS/3% BSA containing torin 1 or Baf A1 (lower panel) for 180 min were used as controls. Non-starved MEFs incubated in medium containing amino acids and serum were used as additional controls. Total cell extracts were prepared and analysed by phospho-p70S6K (p-p70S6K; Thr389) and p70S6K immunoblotting. The positions of the band corresponding to phospho-p70S6K and an unspecific band are marked with an arrow and an asterisk, respectively (lower panel). Equal loading was confirmed by β-tubulin western blotting. The positions of the molecular mass markers are indicated.

