Figure 3.
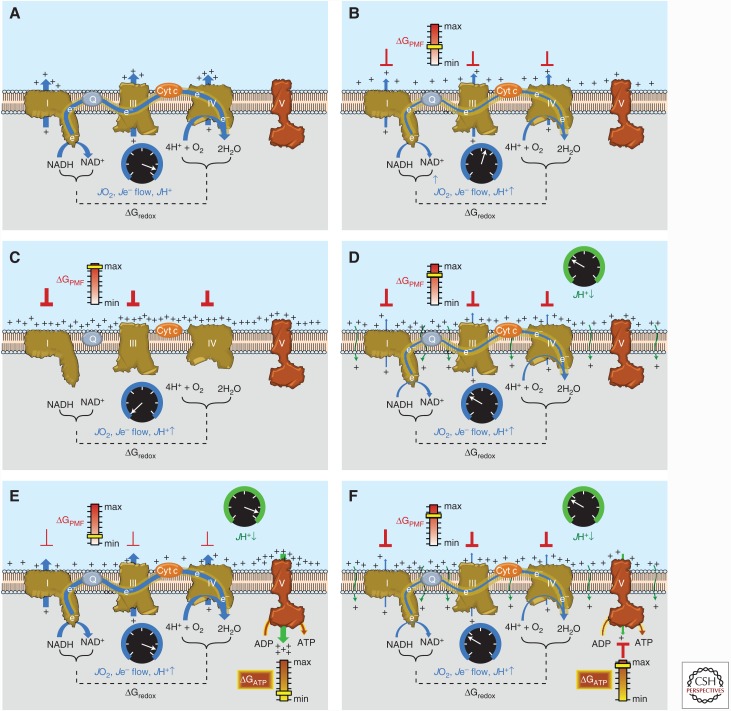
Sequential schematic detailing the driving forces governing the control of mitochondrial oxidative phosphorylation. The reader is encouraged to refer to the text for additional details. (A) Conceptual representation of an electron transport system (ETS) embedded within an artificial membrane vesicle. Addition of reducing equivalents (NADH) generates immediate and rapid rates of O2 consumption (JO2), electron flow (Je− flow), and proton pumping (JH+↑) at complexes I, III, and IV driven by the high ΔGredox between the O2/H2O and NAD+/NADH redox couples. (B) As protons accumulate on the outer surface of the membrane, an electrochemical gradient or proton motive force (PMF) begins to build, creating a free energy backpressure (ΔGPMF) against the pumps, gradually slowing JO2, Je− flow, and JH+↑. (C) Eventually, the backpressure increases to the point that it counterbalances the proton pumps, at which point JO2, Je− flow, and JH+↑ decrease to zero. (D) In mitochondria, basal proton conductance back into the matrix (JH+ ↓) prevents the ΔGPMF from reaching max, thereby allowing JO2, Je− flow, and JH+↑ to proceed at a rate equivalent to the rate of JH+↓. (E) Activation of ATP synthase (complex V) by addition of ADP accelerates proton conductance, thereby lowering ΔGPMF and thus increasing JO2, Je− flow, and JH+↑ accordingly. (F) As [ATP]/[ADP]+[Pi] increases, the free energy associated with ATP hydrolysis (ΔGATP) increases and creates back pressure on the ATP synthase, gradually slowing the rate of ATP synthesis, causing ΔGredox to climb and JO2, Je− flow, and JH+↑ to slow accordingly back to the rate driven by basal proton conductance. Cyt c, Cytochrome c.

