Figure 5.
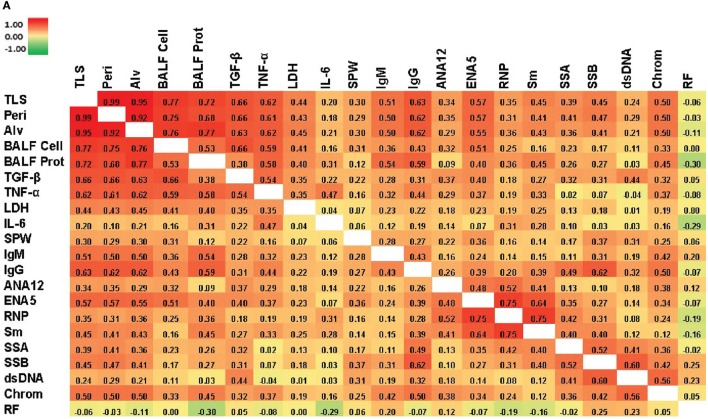
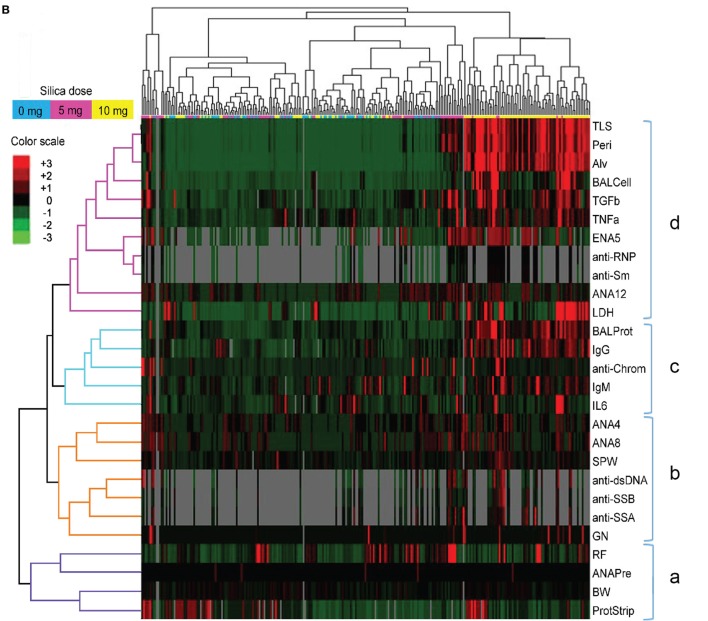
Correlations of biomarkers in silica-exposed diversity outbred mice. (A) Correlation matrix of Spearman’s correlation coefficient (rs) values for mice exposed transorally to 5 or 10 mg of crystalline silica. Spearman’s rs values were calculated using pairwise deletion and represented by a color gradient scale with red = 1, yellow = 0, and green = −1. (B) Hierarchical cluster analysis of phenotypes and samples using a complete linkage clustering method and Spearman Rank Correlation as the similarity metric. Values are reported as relative change from the average of all samples for each phenotype with red = positive relative change, black = no difference, green = negative relative change, and gray = no data available. Dose groups are indicated by the color bar below the sample cluster with blue = 0 mg, purple = 5 mg, and yellow = 10 mg. Separate clusters are defined by a, b, c, and d. Abbreviations: TLS, total lung score; Peri, perivasculitis and peribronchitis; Alv, alveolitis; BALF cell, bronchial alveolar lavage fluid (BALF) total cell number; BALF Prot, BALF protein levels; LDH, lactate dehydrogenase (LDH) activity; SPW, spleen weight; ANA12, anti-nuclear antibody (ANA) score after 12 weeks of exposure; ENA5, designed for the detection of anti-Sm, -RNP, -SS-A (60 kDa and 52 kDa), -SS-B, and -Scl-70 IgG antibodies; RNP, anti-RNP IgG; Sm, anti-Sm IgG; SSA, anti-SSA IgG; SSB, anti-SSB IgG; dsDNA, anti-dsDNA IgG; Chrom, anti-chromatin IgG, ANA4, ANA score after 4 weeks of exposure; ANA8, ANA score after 8 weeks of exposure; ANAPre, ANA score before exposure; BW, body weight; GN, glomerulonephritis; ProtStrip, urine protein using ChemStrip assay.


