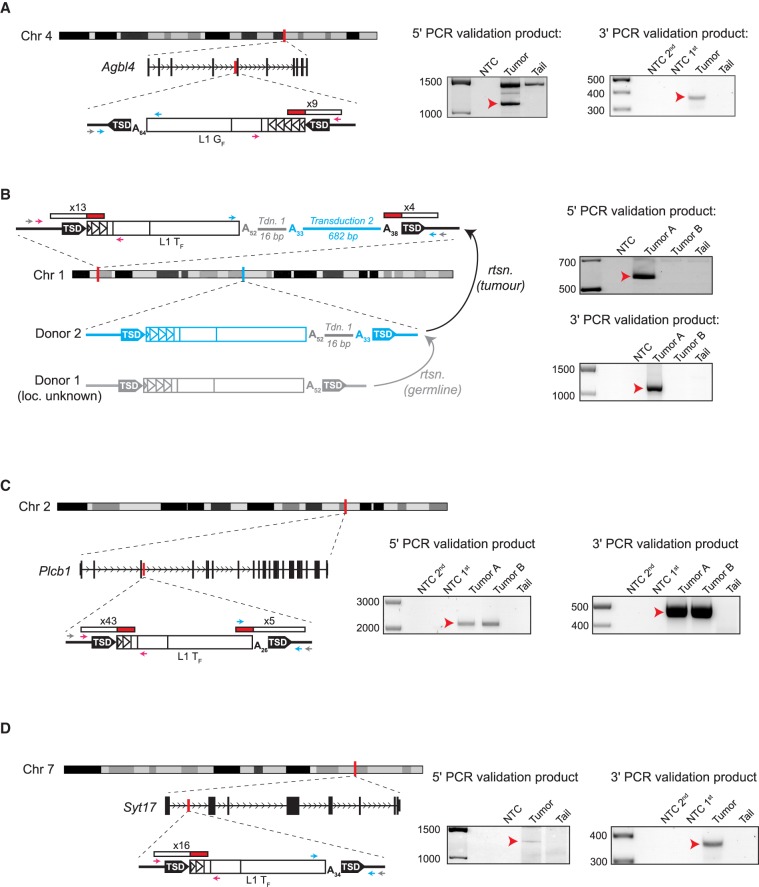
Figure 1.
Tumor-specific L1 insertions in Mdr2−/− animals. For each insertion, the chromosomal location and orientation relative to the interrupted gene, if applicable, are shown. L1 insertions are depicted as white rectangles, with monomer units represented as triangles within the 5′ UTR. Target-site duplications (TSDs) are shown as black arrows. Poly(A) tail length is indicated. The location and count of junction-spanning mRC-seq and WGS reads supporting each insertion are depicted as red and white rectangles. The positions of PCR validation primers are shown as small arrows; where hemi-nested PCR was used, the outer primer is depicted in grey and the inner primers are depicted in pink (5′ junction) and blue (3′ junction). At right, agarose gels containing the 5′ and 3′ junction validation products are shown. Templates are indicated above; for hemi-nested PCR, NTC 1st and NTC 2nd depict the no-template control reactions for the first and second rounds of PCR. Red arrows indicate the validating band. (A) A full-length (4.5 monomer units) L1 GF insertion in antisense orientation within the fourth intron of the gene Agbl4 on Chromosome 4. (B) A full-length (2.5 monomer units) L1 TF insertion in an intergenic region on Chromosome 1. This insertion bore two sequential 3′ transductions of 16 bp (gray line) and 682 bp (blue line). The 682-bp transduction indicated a source L1 for the tumor-specific insertion (Donor 2) on Chromosome 1 (shown in blue). The original source L1 (Donor 1, shown in gray) responsible for the 16-bp transduction could not be identified. (C) A full-length (1.5 monomer units) L1 TF insertion in sense orientation within the third intron of the gene Plcb1 on Chromosome 2. (D) A full-length (1.5 monomer units) L1 TF insertion in sense orientation within the first intron of the gene Syt17 on Chromosome 7.

