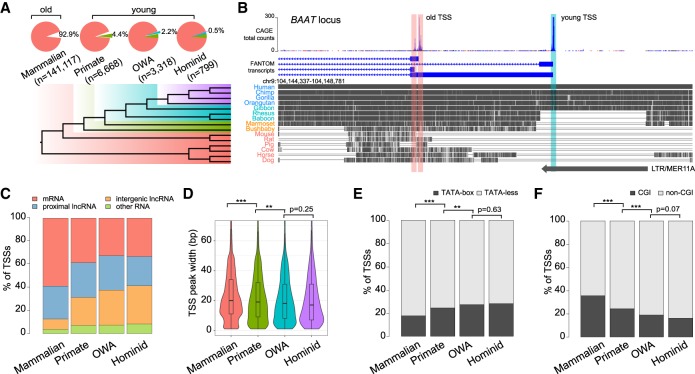
Figure 1.
Classification of human transcription start sites (TSSs) by evolutionary age. (A) (Top) Statistics of four TSS groups defined by sequence age using genomic alignments. (Bottom) Phylogeny with colors indicating the corresponding evolutionary age of each group. OWA = Old World anthropoids. (B) Example BAAT locus containing two “mammalian” TSSs (“old”; red shade) and one “OWA” TSS (“young”; cyan shade). (Top) FANTOM5 CAGE data and annotations indicating different TSSs. (Middle) Multiple genome alignments with gray blocks representing regions of sequence homology in different species. (Bottom) An annotated long tandem repeat (LTR) element overlapping with the young TSS. (C) Composition of associated transcript types in each TSS group. (D) Violin-box plots for TSS peak widths of each TSS group. (E) Proportions of TATA-box-containing and TATA-less TSSs. (F) Proportions of CGI-associated and non-CGI-associated TSSs. Statistical significances in D were calculated by one-tailed Wilcoxon rank-sum tests; statistical significances in E and F by Fisher's exact tests; (**) P < 0.01, (***) P < 0.001.

