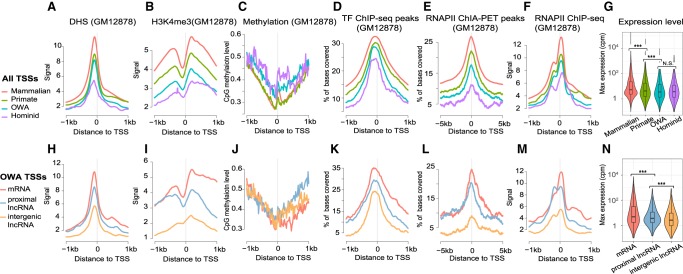
Figure 4.
Distinct functional signatures in different TSS groups. (A) Metaprofiles of DHS signals for four TSS groups using 20-bp bins along TSS ± 1 kb (same bin sizes for other panels). (B) Metaprofiles of H3K4me3 signals. (C) Metaprofiles of CpG methylation levels. (D) Metaprofiles of coverage ratio by TF ChIP-seq peaks. Previously called peaks of 88 TF ChIP-seq data sets from ENCODE were merged, and for every bin of each TSS locus we calculated the proportion of bases covered by merged peaks. (E) Metaprofiles of coverage ratio by RNAP II ChIA-PET peaks. (F) Metaprofiles of RNAP II ChIP-seq signals. (G) Violin-box plots of maximum expression levels of TSSs across primary cell samples, based on the data from FANTOM. (H–N) As in A–G, but specifically for the “OWA” TSS subgroups of different transcript types. All functional genomic data except the expression data are for the GM12878 cell line.

