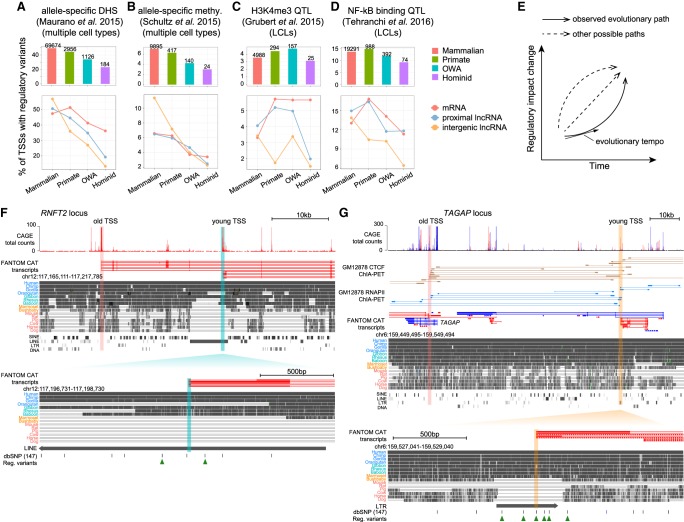
Figure 5.
Temporal and spatial constraints on the regulatory evolution of young TSSs. (A) (Top) Proportion of TSSs harboring regulatory variants associated with allele-specific DHS within TSS ± 1 kb for each TSS group; numbers above bars indicate the numbers of TSSs with regulatory variants. (Bottom) Proportions of TSSs harboring regulatory variants in different TSS subgroups, defined by transcript type. (B) Proportion of TSSs harboring variants associated with allele-specific methylation within TSS ± 1 kb. (C) Proportion of TSSs harboring H3K4me3 QTLs within TSS ± 1 kb. Data generated from lymphoblastoid cell lines (LCLs). (D) Proportion of TSSs harboring NF-kb complex binding (RELA ChIP) QTLs within TSS ± 1 kb. (E) Schematic illustration depicting different possible paths for regulatory evolution of young TSSs. (F) Genome browser view of a young TSS cis-proximal to old TSSs. (Top) FANTOM CAT transcript models (red for forward-strand, blue for reverse-strand); genomic alignments and TE annotations obtained from the UCSC Genome Browser. (Bottom) Enlarged region of an “OWA” TSS inside a LINE element. Beneath the alignments are the common SNPs (allele frequency ≥0.01) from dbSNP database and SNPs associated with regulatory variation. (G) A young TSS trans-proximal to old TSSs. (Top) Similar to F but with additional CTCF and RNAP II ChIA-PET data for GM12878 cell line. (Bottom) Enlarged region of the young TSS. Below the alignments are the common SNPs (allele frequency ≥0.01) and regulatory variants.

