Figure 1.
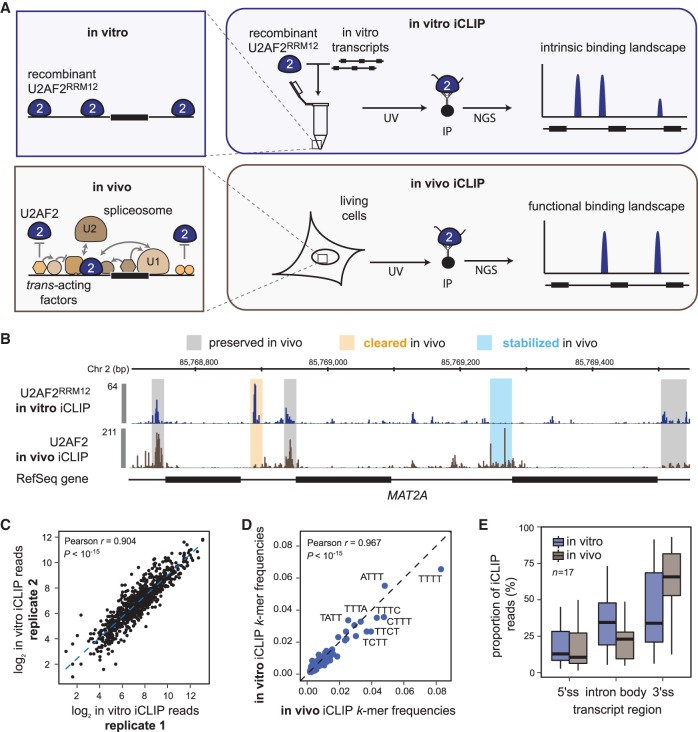
In vitro iCLIP provides intrinsic binding landscapes that can be directly compared to in vivo data. (A) Schematic comparison of in vitro and in vivo iCLIP. Unlike in vivo iCLIP, which identifies RNA–protein interactions in the complex cellular environment, in vitro iCLIP captures the interactions in a simplified system consisting of naked in vitro transcripts and recombinant RBP. (B) Regulated binding sites show strong differences between in vivo and in vitro U2AF2 binding. Genome browser view of U2AF2RRM12 in vitro (blue) and U2AF2 in vivo (brown) iCLIP on MAT2A. In vitro iCLIP was performed with 1.5 µM U2AF2RRM12 and an equimolar pool of 11 in vitro-transcribed RNAs (length 1.7–4.4 kb; final concentration per transcript = 0.2 nM) (Supplemental Table S1). Selected sites that are not regulated (gray), stabilized (blue), or cleared (orange) in vivo are highlighted. (C) Replicate experiments are highly reproducible. Scatter plot of read counts in U2AF2RRM12 binding sites from two independent in vitro iCLIP experiments. Pearson correlation coefficient (r) and associated P-value indicated above. (D) RNA binding preferences are conserved between in vitro and in vivo. Scatter plot showing the frequency of 4-mers in a 9-nt window around U2AF2RRM12 in vitro and U2AF2 in vivo binding sites (from genome-wide in vivo iCLIP data) (Zarnack et al. 2013). Pearson correlation coefficient (r) and P-value indicated above. (E) U2AF2 distribution across transcript regions differs between in vitro and in vivo. Bar diagram showing the proportion of iCLIP reads from U2AF2RRM12 in vitro (blue) and U2AF2 in vivo iCLIP (brown) originating from 5′ splice sites (5′ss), 3′ splice sites (3′ss), and intronic regions (intron body).

