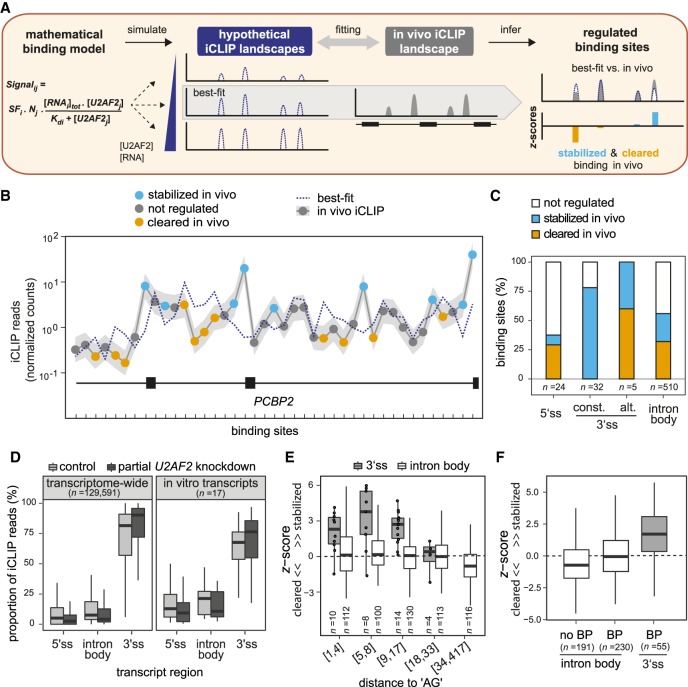
Figure 3.
Comparative modeling of in vitro and in vivo binding reveals numerous sites of U2AF2 regulation. (A) Schematic of in vitro–in vivo fitting to identify regulatory hotspots. Best-fit was obtained by comparing the in vivo binding to hypothetical landscapes that were simulated from the mathematical model of U2AF2RRM12 in vitro binding based on identified Kd values and varying RNA and U2AF2 concentrations. Discrepancies between best-fit and in vivo binding landscape (z-score) were used to infer stabilization (blue) and clearance (orange) in vivo. (B) Comparison of best-fit (dotted blue line) and in vivo landscape (gray line) on PCBP2 showing stabilized (blue) and cleared (orange) U2AF2 binding sites. Gray shadow represents standard deviation of in vivo iCLIP read counts from three independent replicates. (C) The majority of U2AF2 binding sites are regulated. Plot showing the proportion of nonregulated (|z-score| < 1; white), stabilized (z-score > 1; blue), and cleared (z-score < −1; orange) binding sites in different transcript regions (5′ splice sites, constitutive or alternative 3′ splice sites, and intron body). (D) U2AF2 binding is most efficiently maintained at 3′ splice sites upon partial U2AF2 knockdown (KD). Bar plot showing the proportion of U2AF2 in vivo iCLIP reads in control cells (light gray) and upon partial U2AF2 KD (dark gray) for binding sites in different transcript regions. Analyses across transcriptomes (left) as well as restricted to nine tested in vitro transcripts (right) are shown. (E,F) A nearby AG dinucleotide or branch point (BP) motif is not sufficient to explain the substantial U2AF2 stabilization at 3′ splice sites. (E) Box plot showing the z-score distribution of U2AF2 binding sites at 3′ splice sites (gray) and in intron bodies (white). Binding sites were separated into six roughly equal-sized bins with increasing distance to the next AG dinucleotide (between 1 nt and 417 nt; indicated as ranges below). Individual data points are shown for n < 15. (F) Box plot as in E for binding sites without BP (n = 191 binding sites), with upstream BP motif (n = 230), and with upstream BP motif and adjacent 3′ splice site (n = 55).

