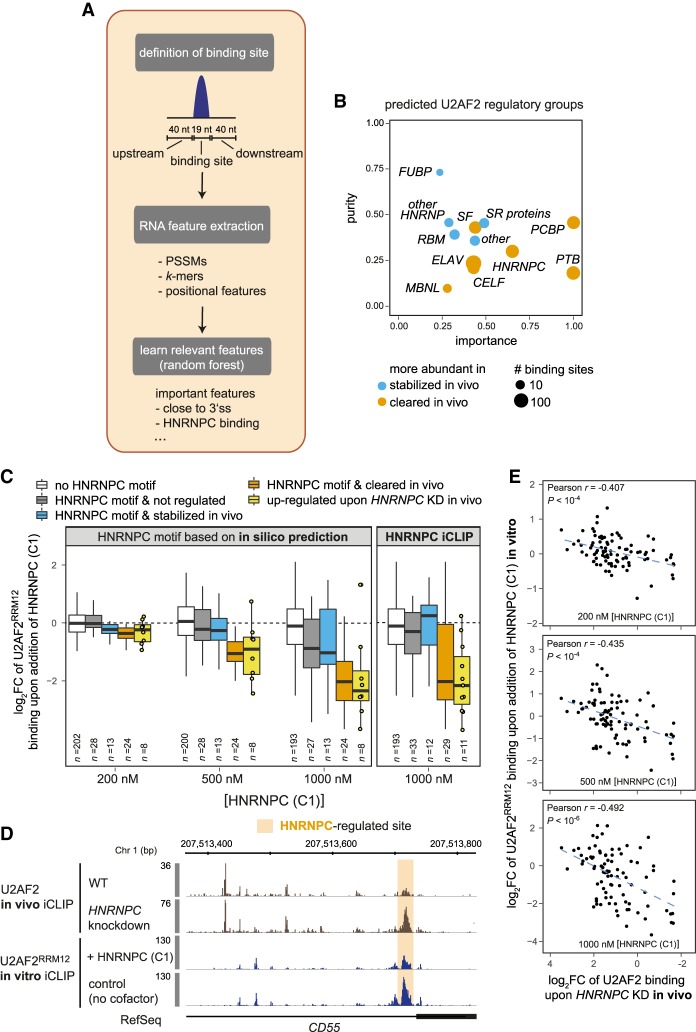
Figure 4.
Random Forests machine learning reveals possible regulators of in vivo U2AF2 binding. (A) Schematic workflow of the Random Forests approach that learns the most relevant features to classify U2AF2 binding sites into stabilized (z-score > 1, 151 sites) or cleared (z-score < −1, 173 sites) in vivo. (B) Twelve regulatory groups are identified as top candidates for in vivo U2AF2 regulation. Plot contrasting the relative importance and purity of collapsed regulatory groups from the top 100 features obtained by Random Forests analysis. Purity indicates specificity of association with a certain direction of regulation (see Supplemental Material). Circle diameter represents scaled number of sites with predicted binding sites of a representative RBP from the group for the predominant direction of regulation (blue = stabilized in vivo, orange = cleared in vivo). (C) HNRNPC (C1) suppresses U2AF2RRM12 binding specifically at sites that are down-regulated in vivo and show overlapping HNRNPC binding according to in silico predictions (left panel) or HNRNPC in vivo iCLIP data (right panel). Box plots of log2-transformed fold-changes (log2FC) of normalized U2AF2RRM12 read counts from in vitro iCLIP cofactor assays with different concentrations of recombinant HNRNPC (C1) (200, 500, and 1000 nM) over a control with U2AF2RRM12 alone. U2AF2 binding sites are subdivided into sites without HNRNPC (white) and sites with HNRNPC but not regulated in vivo (z-score < |0.5|; gray), stabilized in vivo (z-score > 1; blue), or cleared in vivo (z-score < −1; orange). An additional box summarizes all sites with decreased U2AF2 binding upon HNRNPC KD in vivo (log2FC < −1; yellow) (Zarnack et al. 2013). Individual data points are shown for n < 11. (D) In vitro iCLIP recapitulates in vivo competition between HNRNPC and U2AF2. Genome browser view of U2AF2 in vivo iCLIP data (brown) from control and HNRNPC knockdown HeLa cells (Zarnack et al. 2013), as well as in vitro iCLIP data (blue) for U2AF2RRM12 alone (control) and upon addition of recombinant HNRNPC (C1) at HNRNPC-regulated alternative exon of CD55. Orange shading highlights HNRNPC-regulated site. (E) HNRNPC triggers similar regulation of U2AF2 binding in vivo and in vitro. Scatter plots comparing log2FC upon in vitro addition of HNRNPC (C1) (HNRNPC (C1) + U2AF2RRM12/U2AF2RRM12) with log2FC of U2AF2 in vivo iCLIP read counts upon HNRNPC KD (KD/control) for three different concentrations of recombinant HNRNPC (C1). Pearson correlation coefficients (r) and associated P-values are given.

