Figure 5.
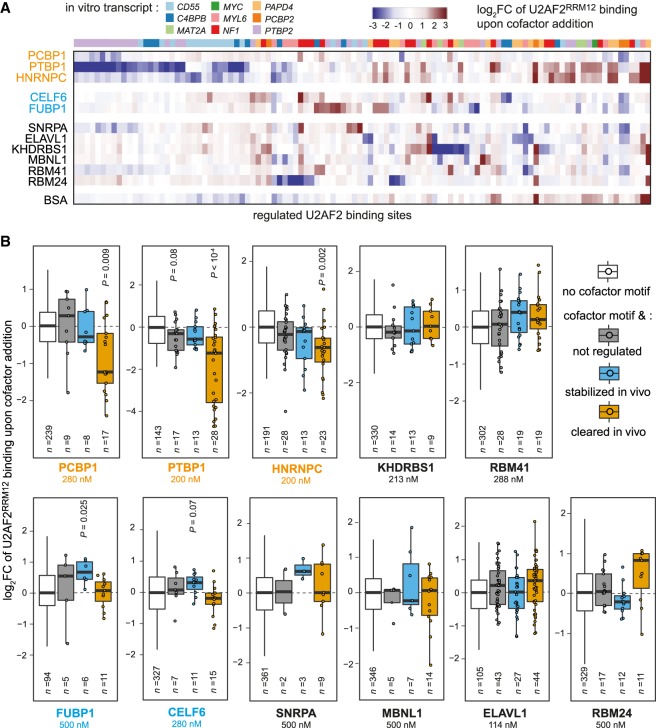
Cofactors change U2AF2RRM12 binding in vitro. (A) Different patterns of U2AF2 regulation by cofactors can be observed in vitro. Heat map showing log2FC of normalized U2AF2RRM12 read counts upon addition of cofactors (U2AF2RRM12 + cofactor/U2AF2RRM12). In vitro transcripts indicated above. Only binding sites with |log2FC| > 2 in at least one cofactor experiment are shown. (B) Several cofactors significantly change U2AF2RRM12 binding. Bar plot showing log2FC upon cofactor addition as in A for sites with no cofactor motif (white) as well as sites with cofactor motif and not regulated (gray, −0.5 < z-score < 0.5), stabilized in vivo (blue, z-score > 1), or cleared in vivo (orange, z-score < −1). Data were scaled such that log2FC of sites without cofactor motif are centered around zero. Added cofactor concentrations are indicated in each panel. Dots indicate individual data points for n < 50. Adjusted P-values are given for all groups with false discovery rate (FDR) < 10% (two-sided Student's t-test, Benjamini–Hochberg correction, compared to binding sites without cofactor motif).

