
Figure 7.
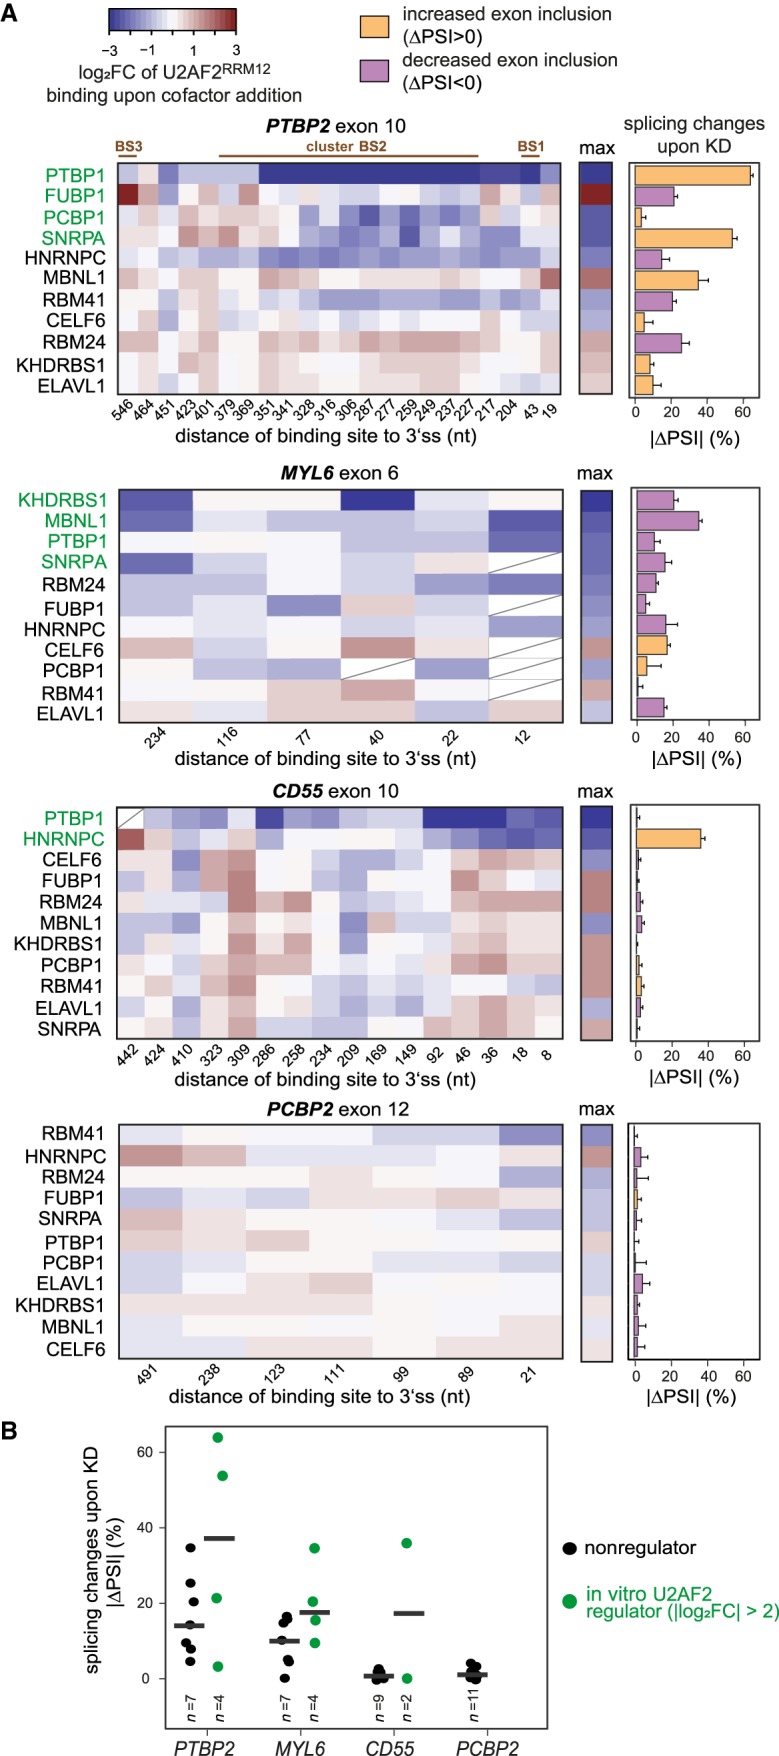
In vitro changes predict in vivo regulation of alternative splicing. (A) Changes in U2AF2RRM12 binding in vitro coincide with effects on alternative exon inclusion upon KD of individual cofactors. (Left panel) Heat maps showing log2FC of normalized in vitro U2AF2RRM12 read counts upon cofactor addition (U2AF2RRM12 + cofactor/U2AF2RRM12) for binding sites within 600 nt of the 3′ splice sites of four alternative exons (PTBP2 exon 10, MYL6 exon 6, CD55 exon 10, and PCBP2 exon 12; note that the preceding introns in MYL6 and PCBP2 are only 304 nt and 510 nt in length, respectively). Cofactors in each heat map are ordered by the maximum change in U2AF2RRM12 binding at any site in vitro (summarized in the middle panel). Binding sites with low coverage are marked with a diagonal line or completely removed if present in less than half of the KD samples. (Right panel) Bar chart showing absolute changes in exon inclusion (percent spliced in, PSI) in vivo upon KD of individual cofactors. Colors indicate direction of splicing change (orange, up-regulation upon KD; purple, down-regulation). Based on their maximum effect on U2AF2RRM12 binding in vitro, cofactors were subdivided into “in vitro U2AF2 regulators” (green, maximal |log2FC| > 2 in U2AF2RRM12 binding upon cofactor addition) and “nonregulators” (white, maximal |log2 FC| ≤ 2). Error bars represent standard deviation of the mean (n = 3). (B) Cofactors that significantly influence U2AF2RRM12 binding in vitro trigger stronger splicing changes in vivo. Dot plot showing ΔPSI upon cofactor KDs for four alternative exons. Coloring of in vitro U2AF2 regulators and nonregulators as in A.