Figure 5.
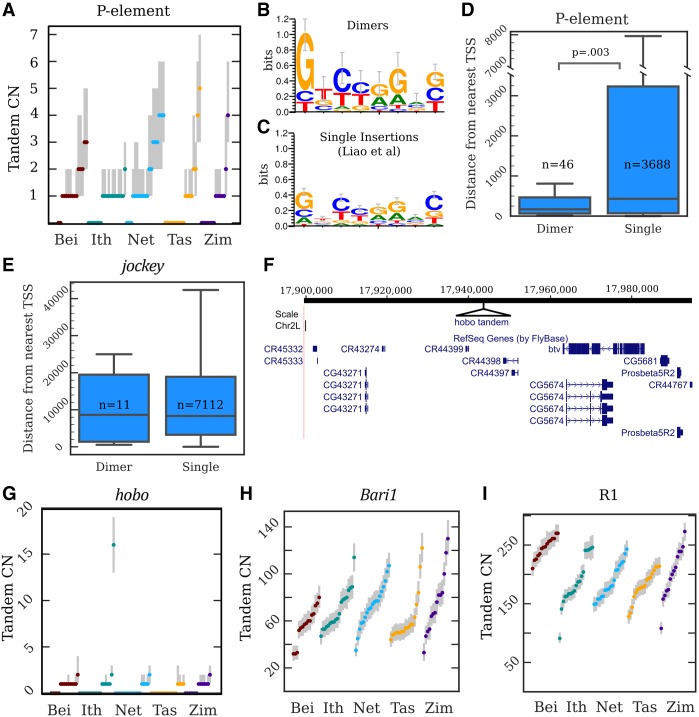
Copy number, location, and sequence of TE tandem junctions. (A) Copy number (CN) distributions for the P-element. The dots are maximum a posteriori estimates in a particular strain, while the gray lines indicate 98%-credible intervals. (B,C) Sequence logos constructed from the 8-nt motifs found within the junctions of P-element tandem dimers (B) and the P-element TSDs described by Liao et al. (2000) (C). (D) A boxplot depicting the distances to the nearest TSS for P-element dimers and single insertions. (N) Counts of insertions in each category; (p) Kolmogorov–Smirnov test. (E) A similar plot for jockey elements; there is no significant difference between singles and dimers. (F) A UCSC Genome Browser view of the region on Chromosome 2L inferred to contain the hobo tandem array in strain I03, with the site of the hobo tandem added in as a black triangle. (G–I) CN distributions for hobo (G), Bari1 (H) and R1 (I) tandems. The dots are maximum a posteriori estimates in a particular strain, while the gray lines indicate 98%-credible intervals.

