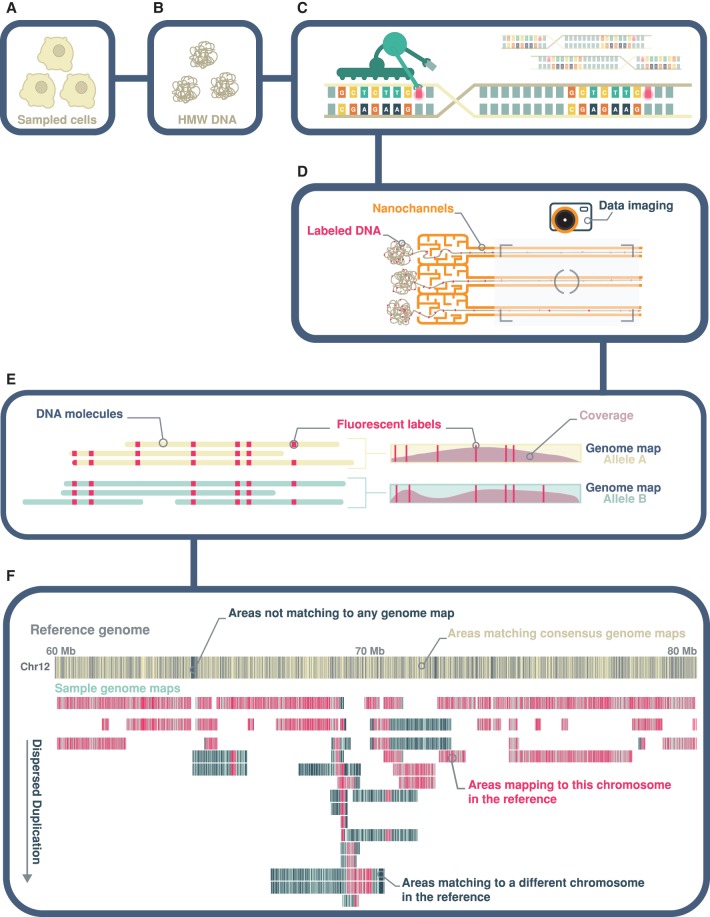
Figure 1.
Whole-genome optical mapping. (A,B) Genome mapping begins with the extraction of intact, high molecular weight (HMW) double-stranded DNA. (C) An endonuclease (Nt.BspQI) that cleaves only one strand of a double-stranded DNA is used to incorporate a fluorescent dye at recognition motifs (GCTCTTCN↓) at a density of 8–11 labels per 100 kb. The DNA backbone is also stained with a second fluorescent dye, YOYO-1. (D) Labeled molecules are linearized, flowed into nanochannels, and imaged using the Bionano Irys instrument. (E) Imaged molecules are digitized and bioinformatically assembled into consensus genome maps and haplotype-phased as appropriate. (F) SVs relative to a reference genome are deduced based on differences in size and/or label patterns. Highly rearranged genome maps will align piecewise to multiple reference genomic regions. Conversely, heavily rearranged regions of the reference genome will show alignments from multiple genome maps (dispersed duplication). In this study, the reference genome map is an in silico digest of the human reference, GRCh38. In this figure, sample consensus genome maps are represented as teal-colored horizontal bars, overlaid with coverage density plots in mauve, whereas GRCh38 Chr 12 is shown as a gray horizontal bar. Fluorescent labels of the Nt.BspQI motif are shown as yellow and pink vertical lines overlaid on the reference and sample genome maps, respectively. Labels on the reference not aligned to any consensus genome map and labels on sample genome maps not aligned to the displayed reference chromosome(s) are shown in dark blue.

