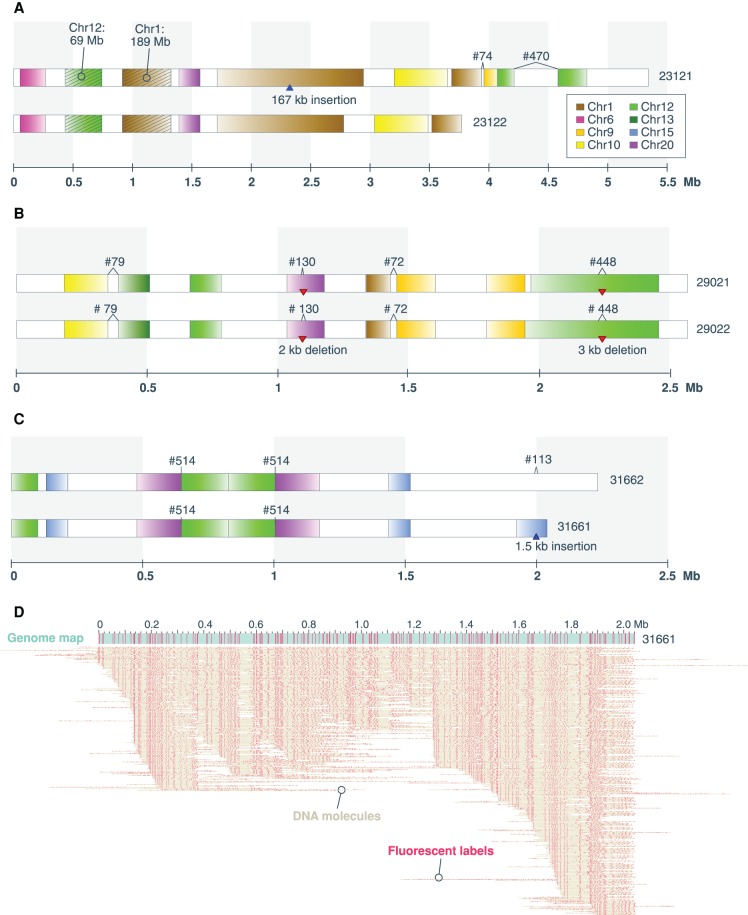
Figure 4.
Fusion map examples. (A–C) Schematics of three fusion haplomap pairs containing complex genomic rearrangements. Genome map sizes are indicated on the horizontal axis, in megabase units. In each panel, fragments aligning to GRCh38 chromosomes are indicated by the default UCSC chromosome color scheme (color key in A). Uncolored (white) intervals correspond to regions not aligned to the reference. Alignment orientation to GRCh38 is indicated by color to white gradient corresponding to 5′ to 3′ alignment to the positive strand. Deletions and insertions are indicated by red downward triangles and blue upward triangles, respectively. The two most frequently represented reference fragments (Chr 1: 188,188,529–189,139,998 and Chr 12: 68,713,897–69,940,974) found in the fusion maps are shown with diagonal stripes and indicated as Chr 1: 189 Mb and Chr 12: 69 Mb. Previously identified fusions from sequencing data are numbered per Supplemental Table S1 (cf. Garsed et al. 2014) and indicated above the genome maps. (D) The molecules are aligning to, and making up, consensus genome map #31661, which contains an inverted chained fusion as shown in C. Here, the 2-Mb consensus genome map is represented by a teal horizontal bar following the convention in Figure 1. Individual molecules are represented as “dots on a string,” where each yellow horizontal line represents a molecule, and pink dots represent fluorescent labels. A–C are a subset of the 72 fusion maps shown in Supplemental Figure S3.

