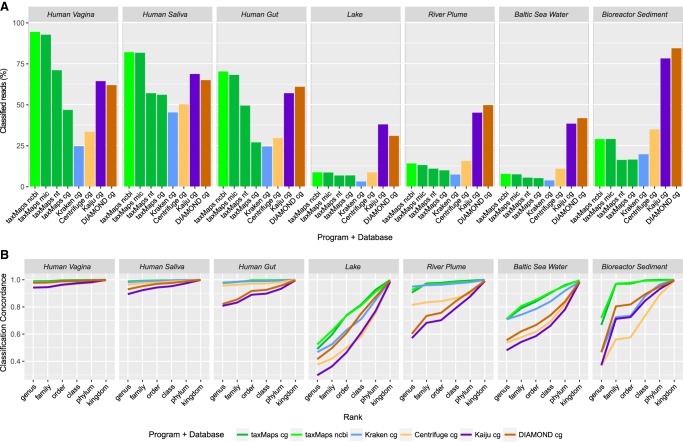
Figure 3.
Percentage of classified reads and classification concordance for seven real metagenomics data sets. (A) Percentage of classified read pairs for three human microbiome and four environmental samples. (B) Classification concordance between paired mates, as proxy of precision, for six major taxonomic ranks.

