
Figure 3.
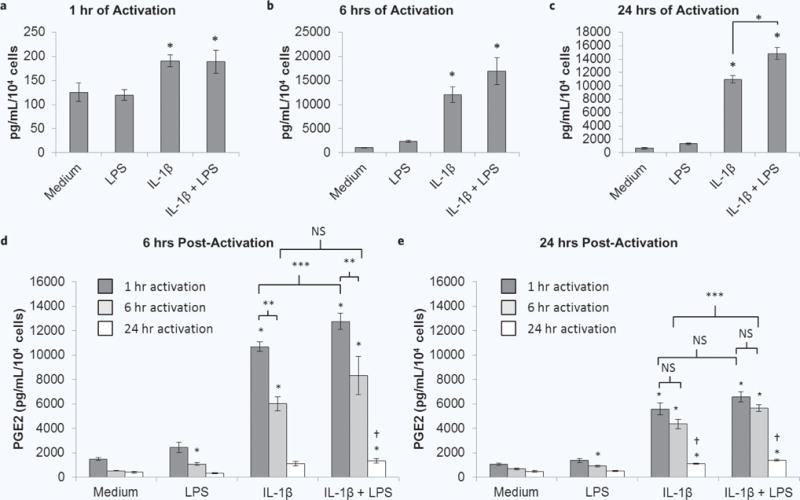
MSC PGE2 secretion at the end of the activation period and over time post-activation. MSCs were cultured without or with IL-1β, LPS or both for (a) 1, (b) 6, or (c) 24 hours. These supernatants were collected and analyzed for PGE2. Supernatants of MSCs that were activated by IL-1β, LPS or both for 1 (dark grey bars), 6 (light grey bars), or 24 (white bars) hours were replaced by fresh medium for (b) 6 or (c) 24 hours, which was collected and analyzed for PGE2. Data are the mean ± SEM for PGE2 normalized to cell number for n = 6 replicates. *p < 0.05 compared to medium by Student’s t test; **p < 0.05 by Student’s t test; ***p < 0.05 by ANOVA and Fisher’s LSD; †p < 0.05 compared to 1 or 6 hours of pre-activation by ANOVA and Fisher’s LSD.