
Figure 7.
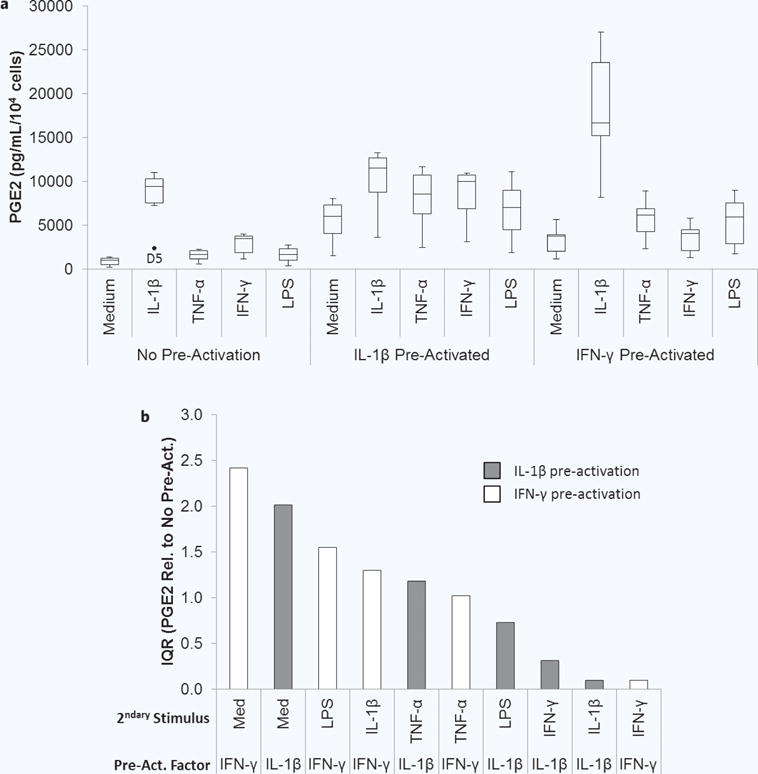
Two donor variability in pre-activated MSC response to secondary pro-inflammatory stimuli. (a) Box and whisker plots display the minimum, first quartile, median (second quartile), third quartile, maximum, and outliers in the normalized PGE2 level secreted by the donors for each activation condition. (b) The interquartile range (IQR) is the difference between the first and third quartile and is plotted for the fold change in PGE2 compared to no pre-activation for each activation condition in the order of highest to lowest (grey bars are IL-β pre-activated; white bars are IFN-γ pre-activated).