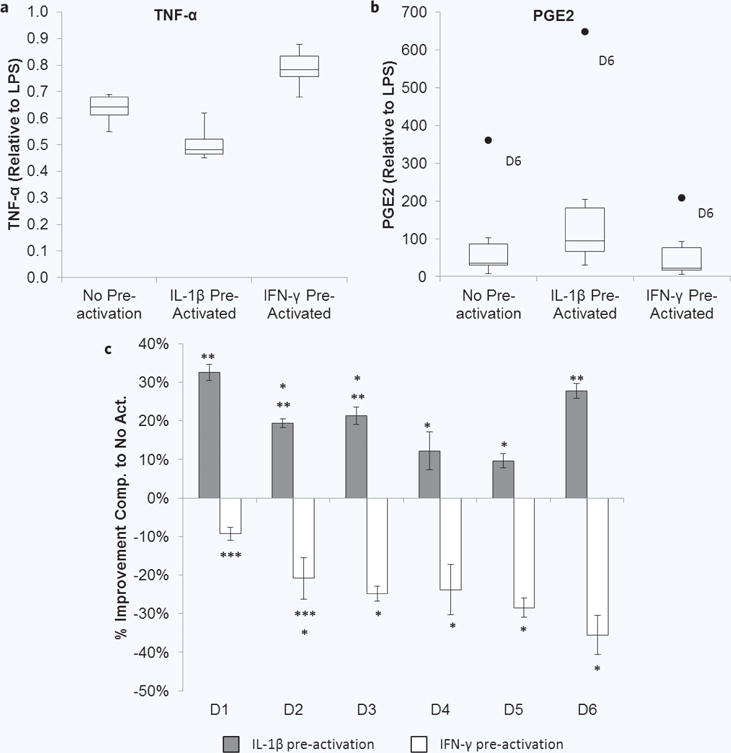
Figure 9.

Donor variability in pre-activated MSC modulation of macrophages. Box and whisker plots display the minimum, first quartile, median (second quartile), third quartile, maximum, and outliers in the (a) TNF-α level (normalized to LPS) and (b) PGE2 (normalized to LPS) present in the co-cultures for each activation condition. (c) Comparison of percent improvement in TNF-α reduction imparted by pre-activation. Improvement in attenuation of TNF-α was determined using the percent change in relative TNF-α level for IL-1β pre-activated (grey bars) and IFN-γ pre-activated (white bars) MSC conditions compared to no pre-activation for each donor. Negative values indicate impaired attenuation of TNF-α. *p < 0.05 compared to donor 1, **p < 0.05 compared to donor 5, ***p < 0.05 compared to donor 6 by ANOVA with Fisher’s LSD.
