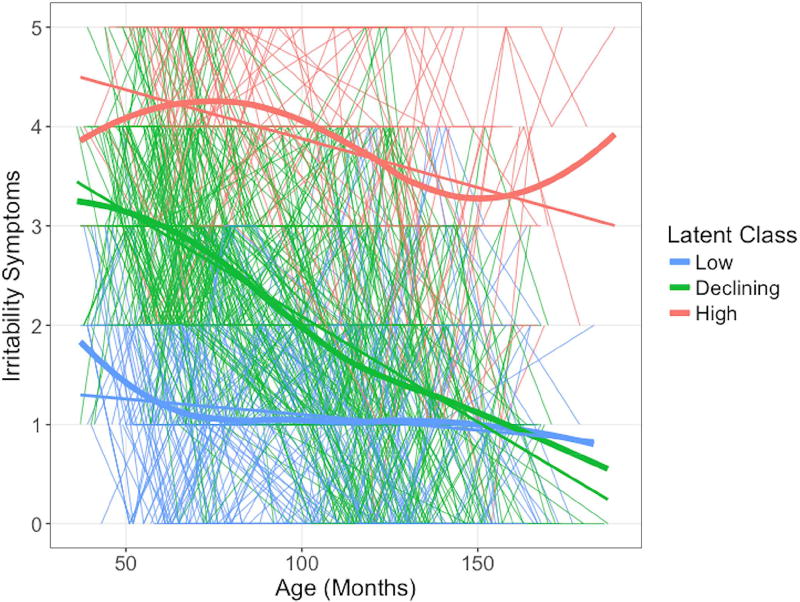
Figure 1. Irritability Trajectory Classes.
Note: The low, declining, and high irritability latent trajectory classes are displayed here. Individual participant irritability severity scores (y-axis; PAPA/CAPA sum scores) at each assessment wave are presented in the thin lines (i.e. one line per participant), time locked to the child’s age at assessment indicated in months on the x-axis. Thicker lines display the linear slope and loess fit lines of irritability severity for each trajectory class across age.

